Config: Getting Started
Posted: Fri Aug 03, 2007 2:11 am
NetFlow/sFlow/IPFIX
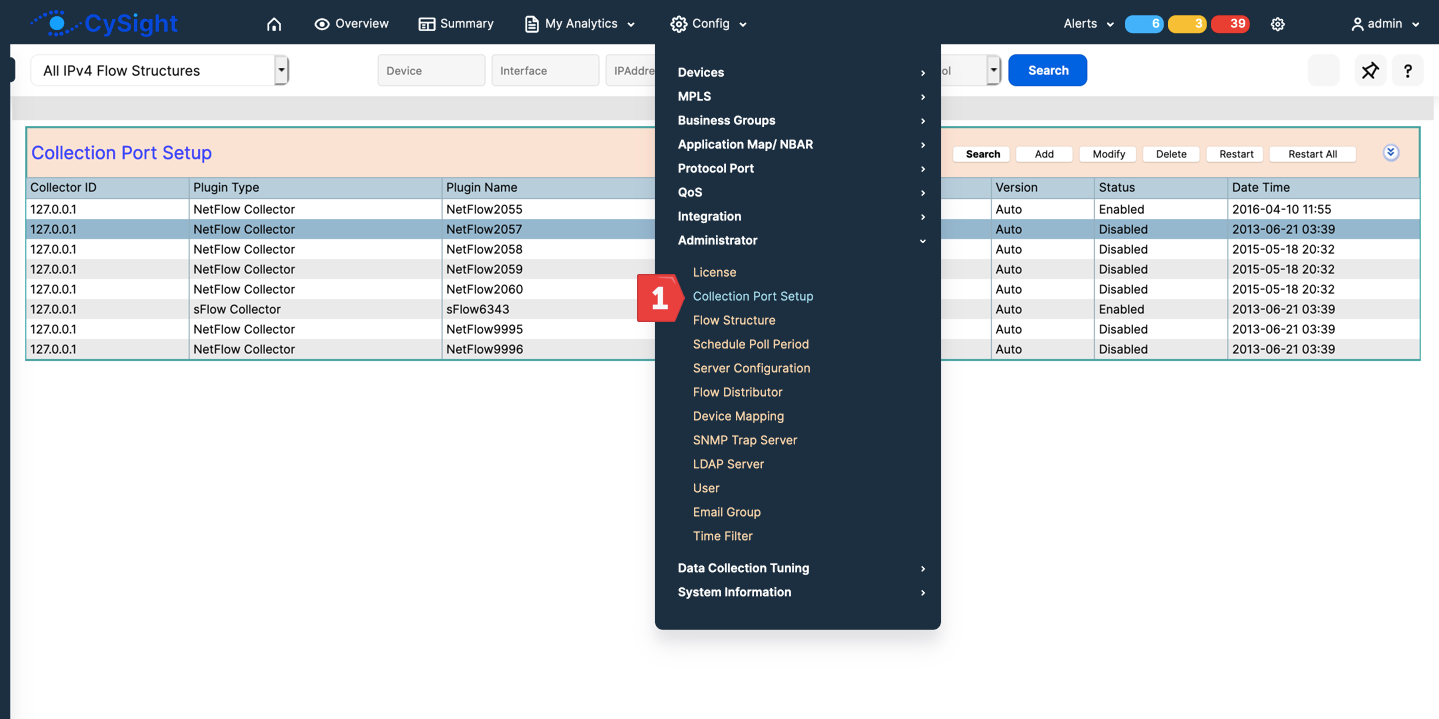
Direct your NetFlow/IPfix to the CySight server on default port 2055.
Direct your sFlow to the CySight server on default port 6343.
After installing your license key, your Flow device will be identified automatically and will be visible under the Device screen when you login.
Ports can be changed or added as required.
If you are installing Linux please use only the supported Redhat/Centos Linux and please follow the installation instructions and tuning suggestions in Config: Linux Config and Tuning Checklist.
Client Browser Requirements
The client PC must have the following installed:
Firefox, Chrome or Internet Explorer supporting SVG/HTML5.
Logging In
Enter the CySight IP in your browser’s address bar:
http://{CySight IP-address}:8080
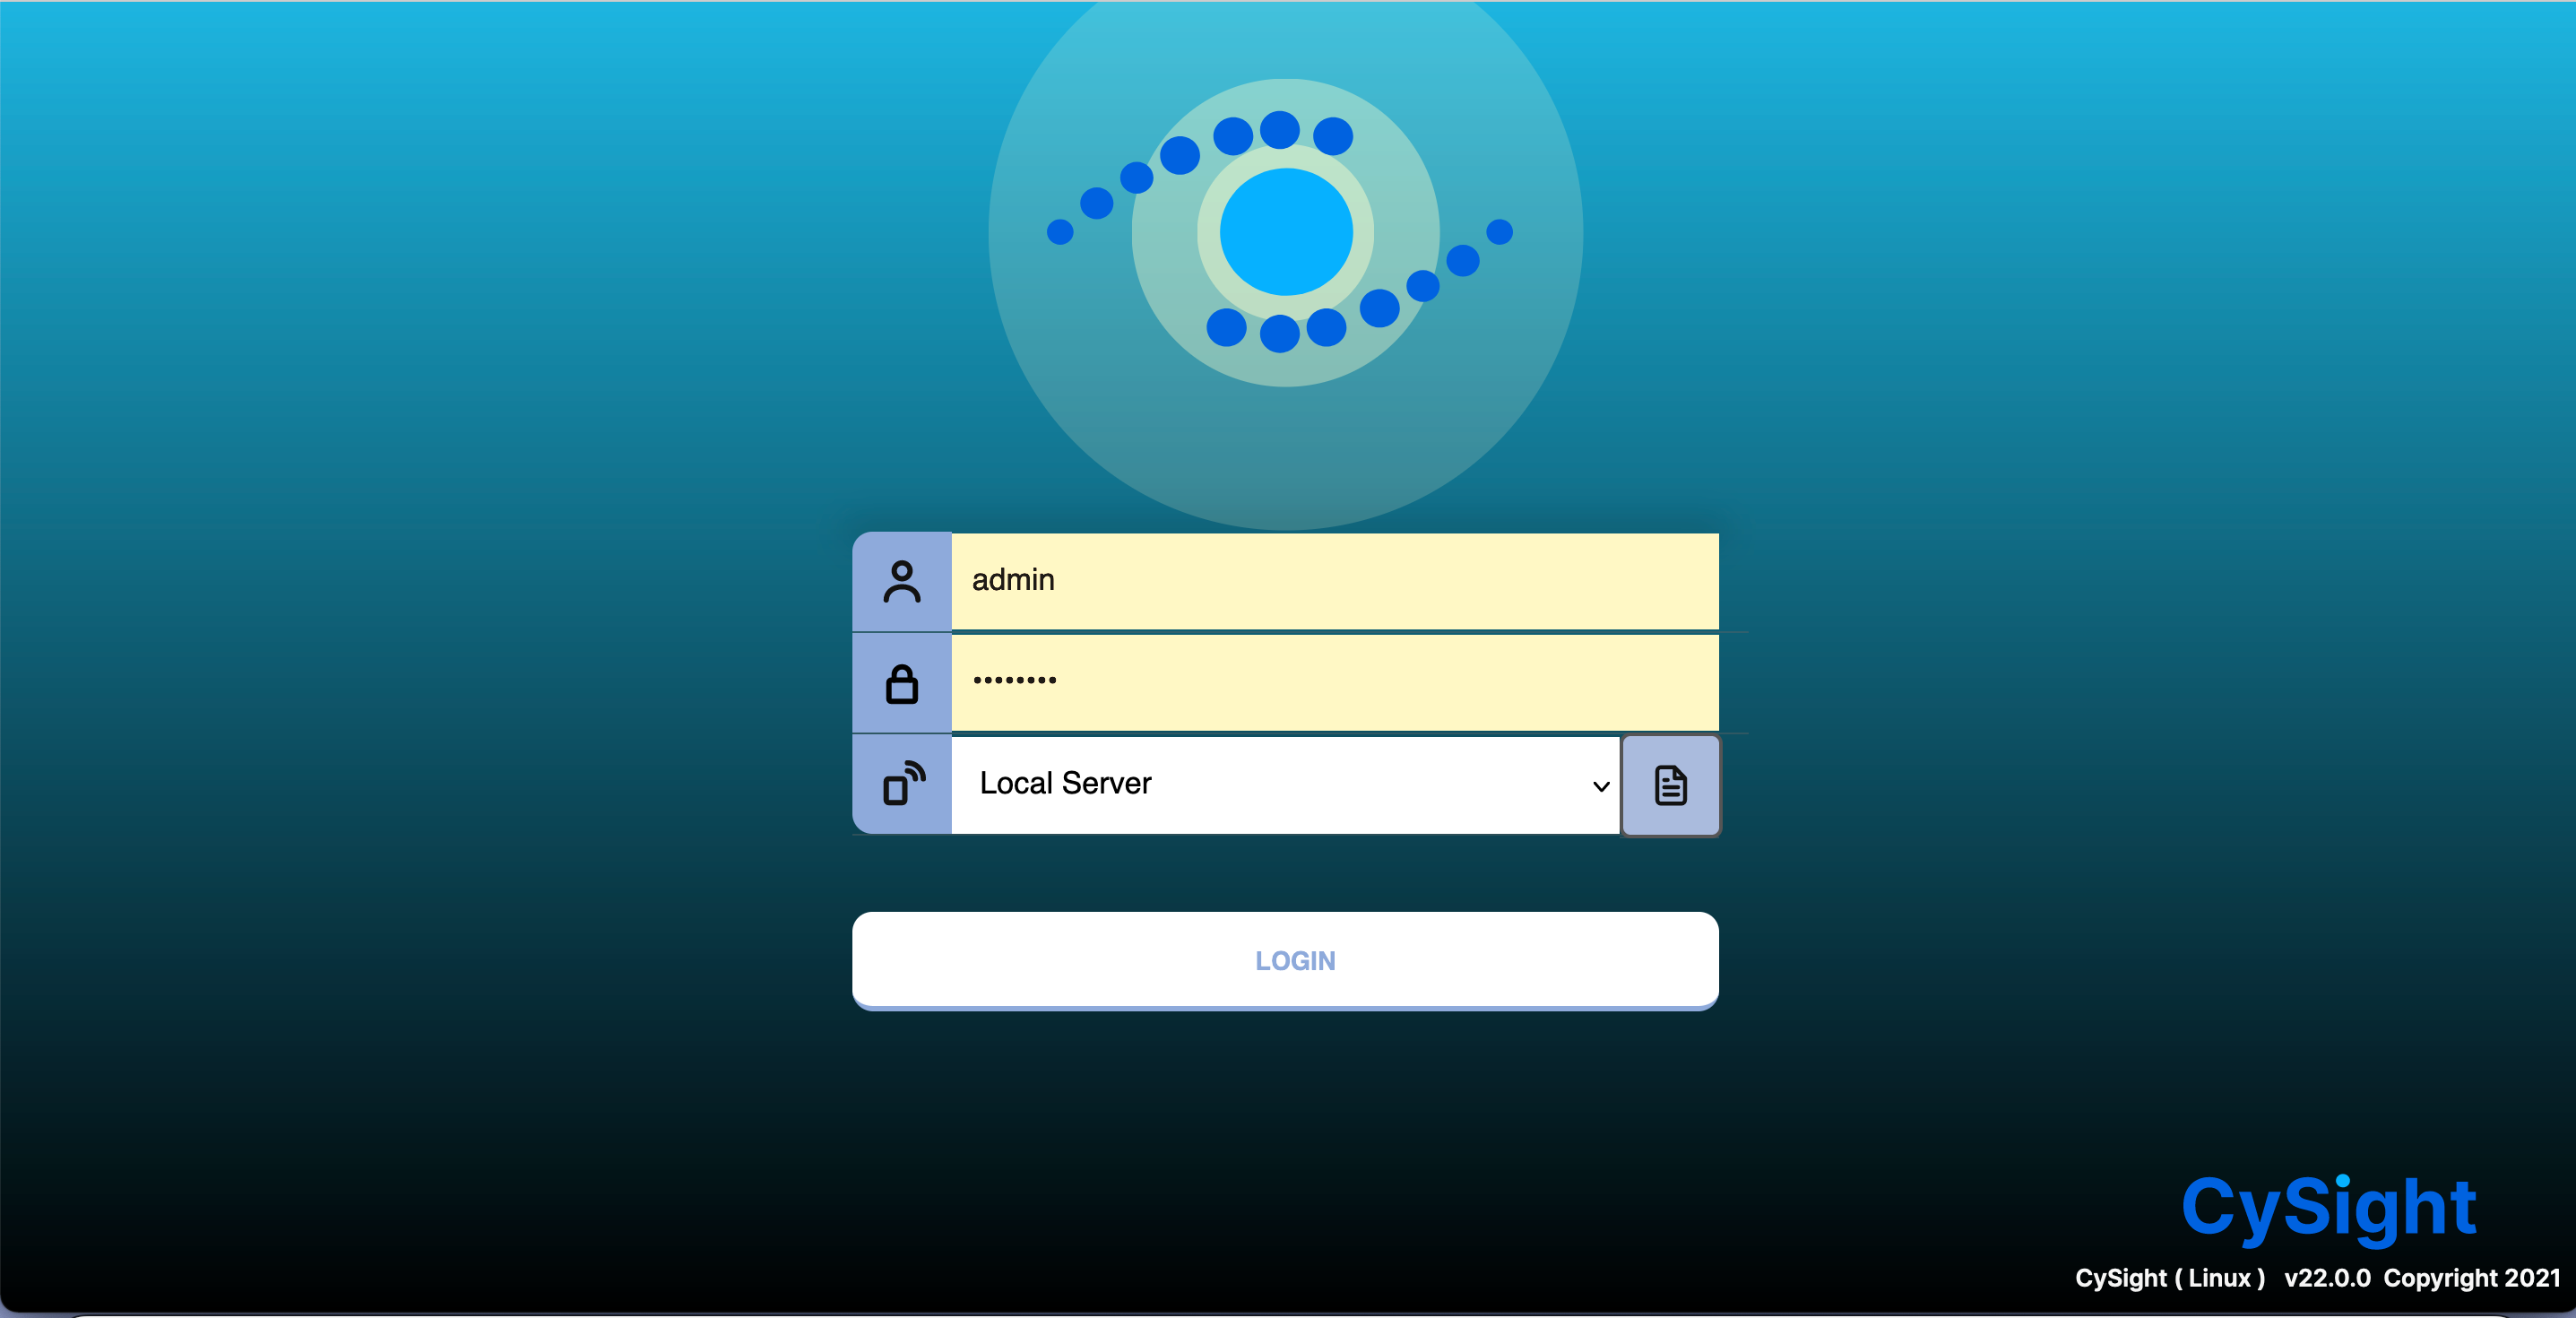
Once the license is active the left menus will activate.
The License key can be inserted using the license management screen (Configuration -> Administration -> License) or copied into the keyblocks directory as described below.
Click "Load" then Browse to select your license key. Press "Confirm" to Insert it.
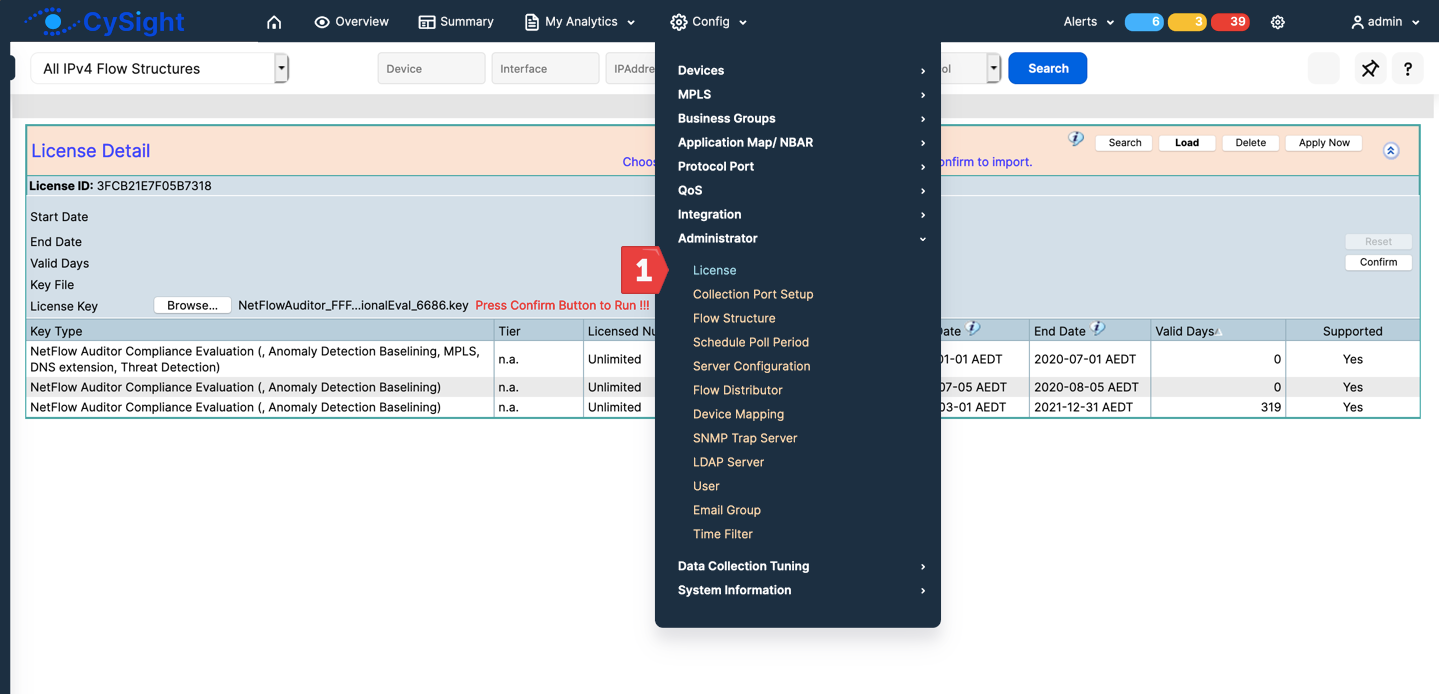
The evaluation license is set to retain the top 5000 flows per minute per device which substantial granularity and high quality forensics and alerting that suits most environments. It can be configured to retain all flows or less.
Edit your NetFlow devices and set the SNMP community String to enable automated bandwidth and interface name discovery.
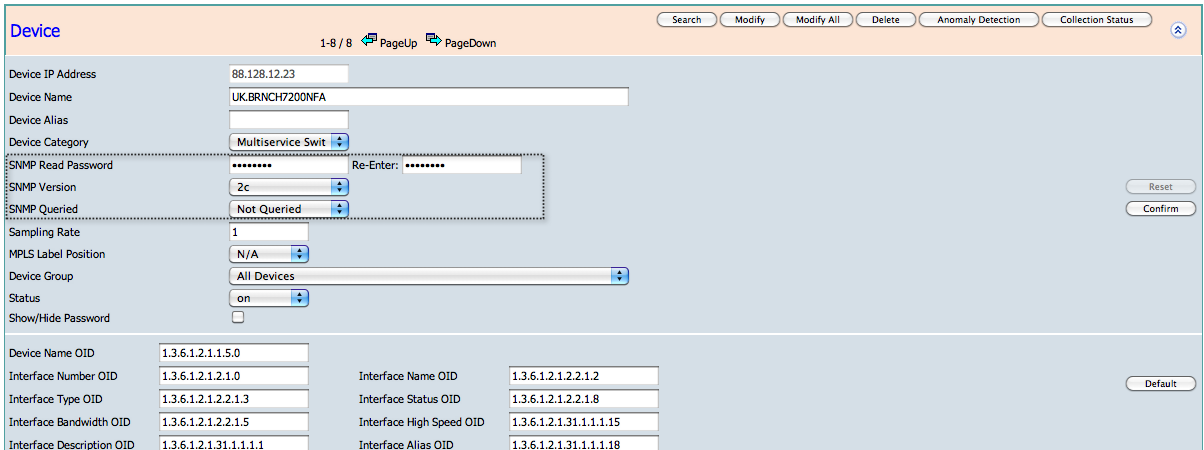
Click Configuration> Devices> Device and highlight a device in the grid, then click "Modify" to setup your device. After making your change click "Confirm" to save.
Overview and Homepages
Dashboards
CySight Dashboards enable multiple views on a single screen. It brings to the fore our latest AI technology enabling continual analysis and mitigation. Smart widgets allow you to see exactly what is happening in milliseconds of an attack followed by an AI Diagnostics of what happened and a Threat Diagnostics of Lateral Attacks and Predictive AI Impact analysis.
GA Availability November 2024. Beta availability October 2024.
Main Dashboard
Overview
Homepage
Getting Started Additional Notes
Installation, configuration and general usage can be found in CySight Knowledge base with latest documentation guides available on Visual Analytics, Multiviews, Forensics , IPv6 and more.
Direct your NetFlow/IPfix to the CySight server on default port 2055.
Direct your sFlow to the CySight server on default port 6343.
After installing your license key, your Flow device will be identified automatically and will be visible under the Device screen when you login.
Ports can be changed or added as required.

CySight is already the most scalable collector in the industry. For larger environments wishing to conserve hardware, using more than one port with multiple devices will enable additional performance due to additional multi-threading.Operating System Installation Notes
If you are installing Linux please use only the supported Redhat/Centos Linux and please follow the installation instructions and tuning suggestions in Config: Linux Config and Tuning Checklist.
Client Browser Requirements
The client PC must have the following installed:
Firefox, Chrome or Internet Explorer supporting SVG/HTML5.
Logging In
Enter the CySight IP in your browser’s address bar:
http://{CySight IP-address}:8080

Once the license is active the left menus will activate.
The login screen provides an option to Authenticate using the LDAP Server that has been configured by the AdministratorLogin to the CySight front end.
Code: Select all
Username: admin, Password: adminIts good practice to change your admin user and password after installationLicense Key installation
The License key can be inserted using the license management screen (Configuration -> Administration -> License) or copied into the keyblocks directory as described below.
Click "Load" then Browse to select your license key. Press "Confirm" to Insert it.

The evaluation license is set to retain the top 5000 flows per minute per device which substantial granularity and high quality forensics and alerting that suits most environments. It can be configured to retain all flows or less.
If you need to test forensics depth please request a meeting sales@cysight.ai.Alternatively, please copy the license key to your "keyblocks" directory and restart CySight. The keyblocks directory can be found in /DigiToll/digiTolBE/keyblocks for Windows systems and /digitoll/keyblocks/digitoll/ for Linux
A Device will be added automatically. A device cannot be added manually. As long as the exporters have been setup correctly the devices will be automatically identified.SNMP
Edit your NetFlow devices and set the SNMP community String to enable automated bandwidth and interface name discovery.

Click Configuration> Devices> Device and highlight a device in the grid, then click "Modify" to setup your device. After making your change click "Confirm" to save.
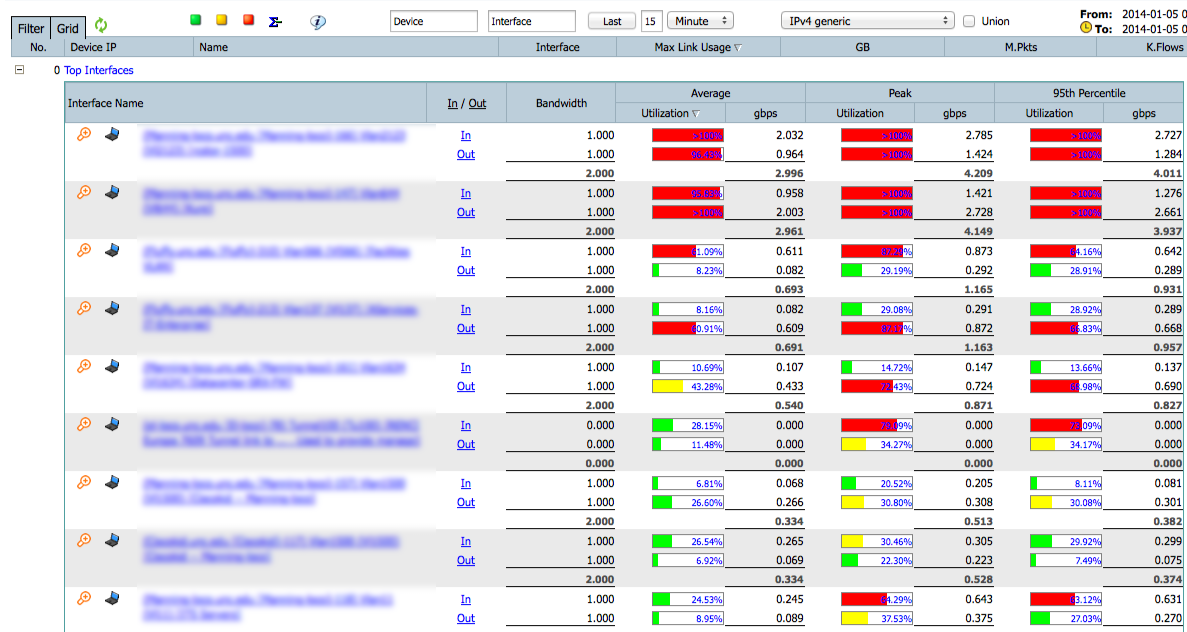
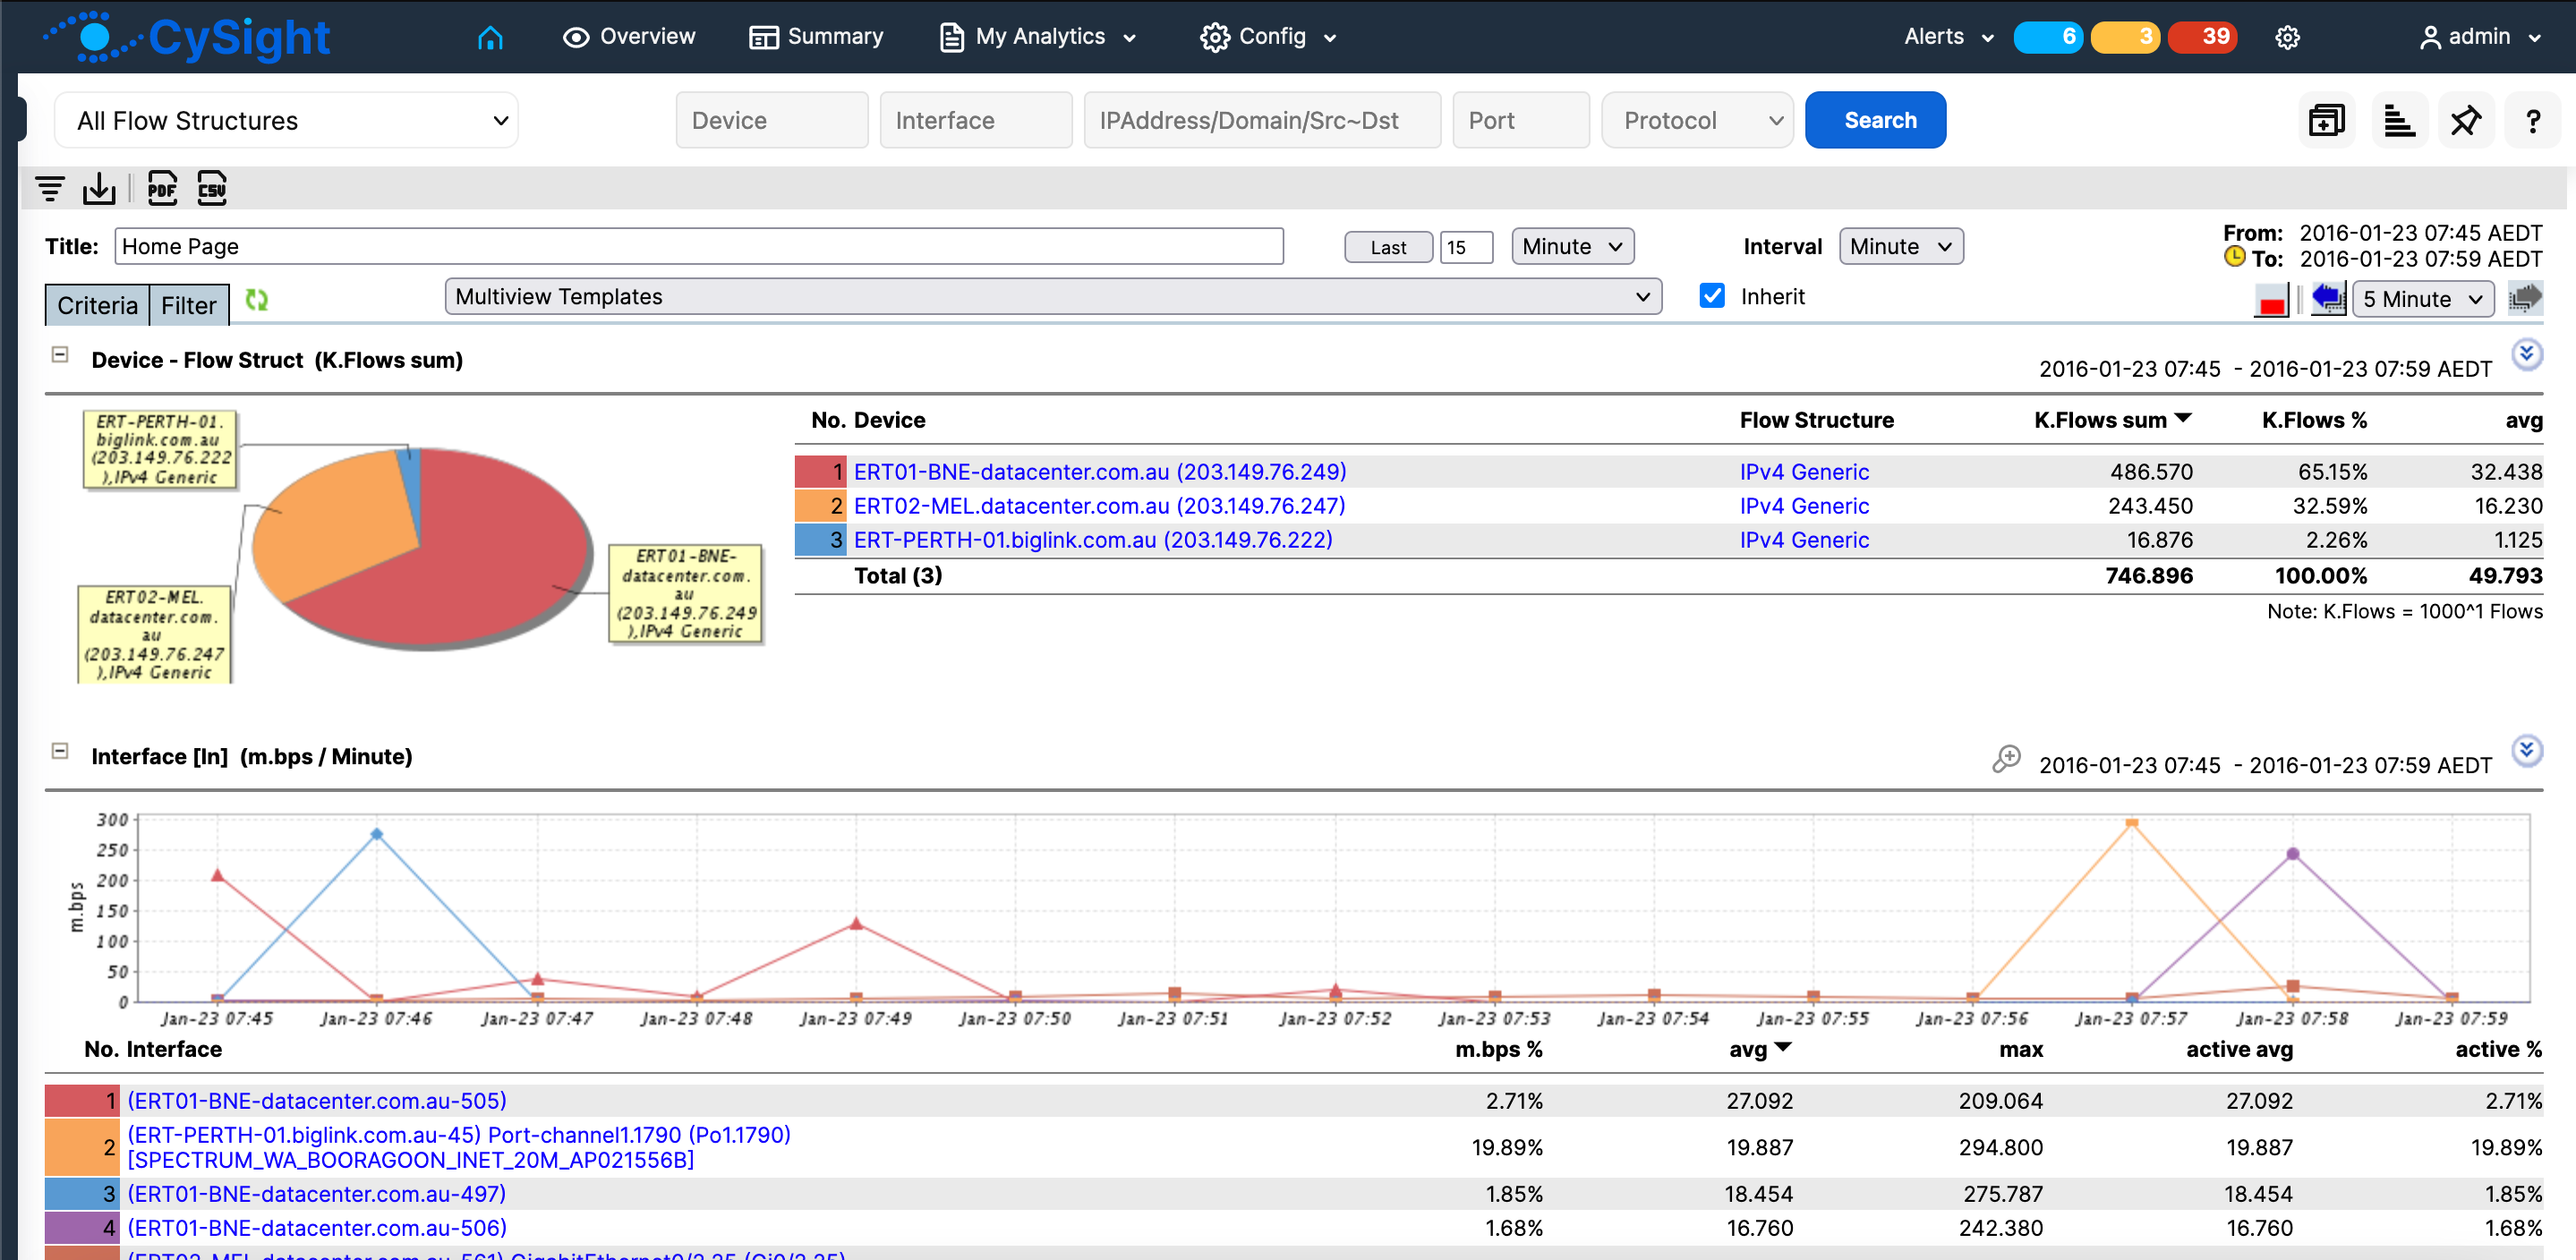
Overview and Homepages
The Overview and Homepage screens will take a few minutes to collate information before displaying data.Overview
Dashboards
CySight Dashboards enable multiple views on a single screen. It brings to the fore our latest AI technology enabling continual analysis and mitigation. Smart widgets allow you to see exactly what is happening in milliseconds of an attack followed by an AI Diagnostics of what happened and a Threat Diagnostics of Lateral Attacks and Predictive AI Impact analysis.
GA Availability November 2024. Beta availability October 2024.
Main Dashboard

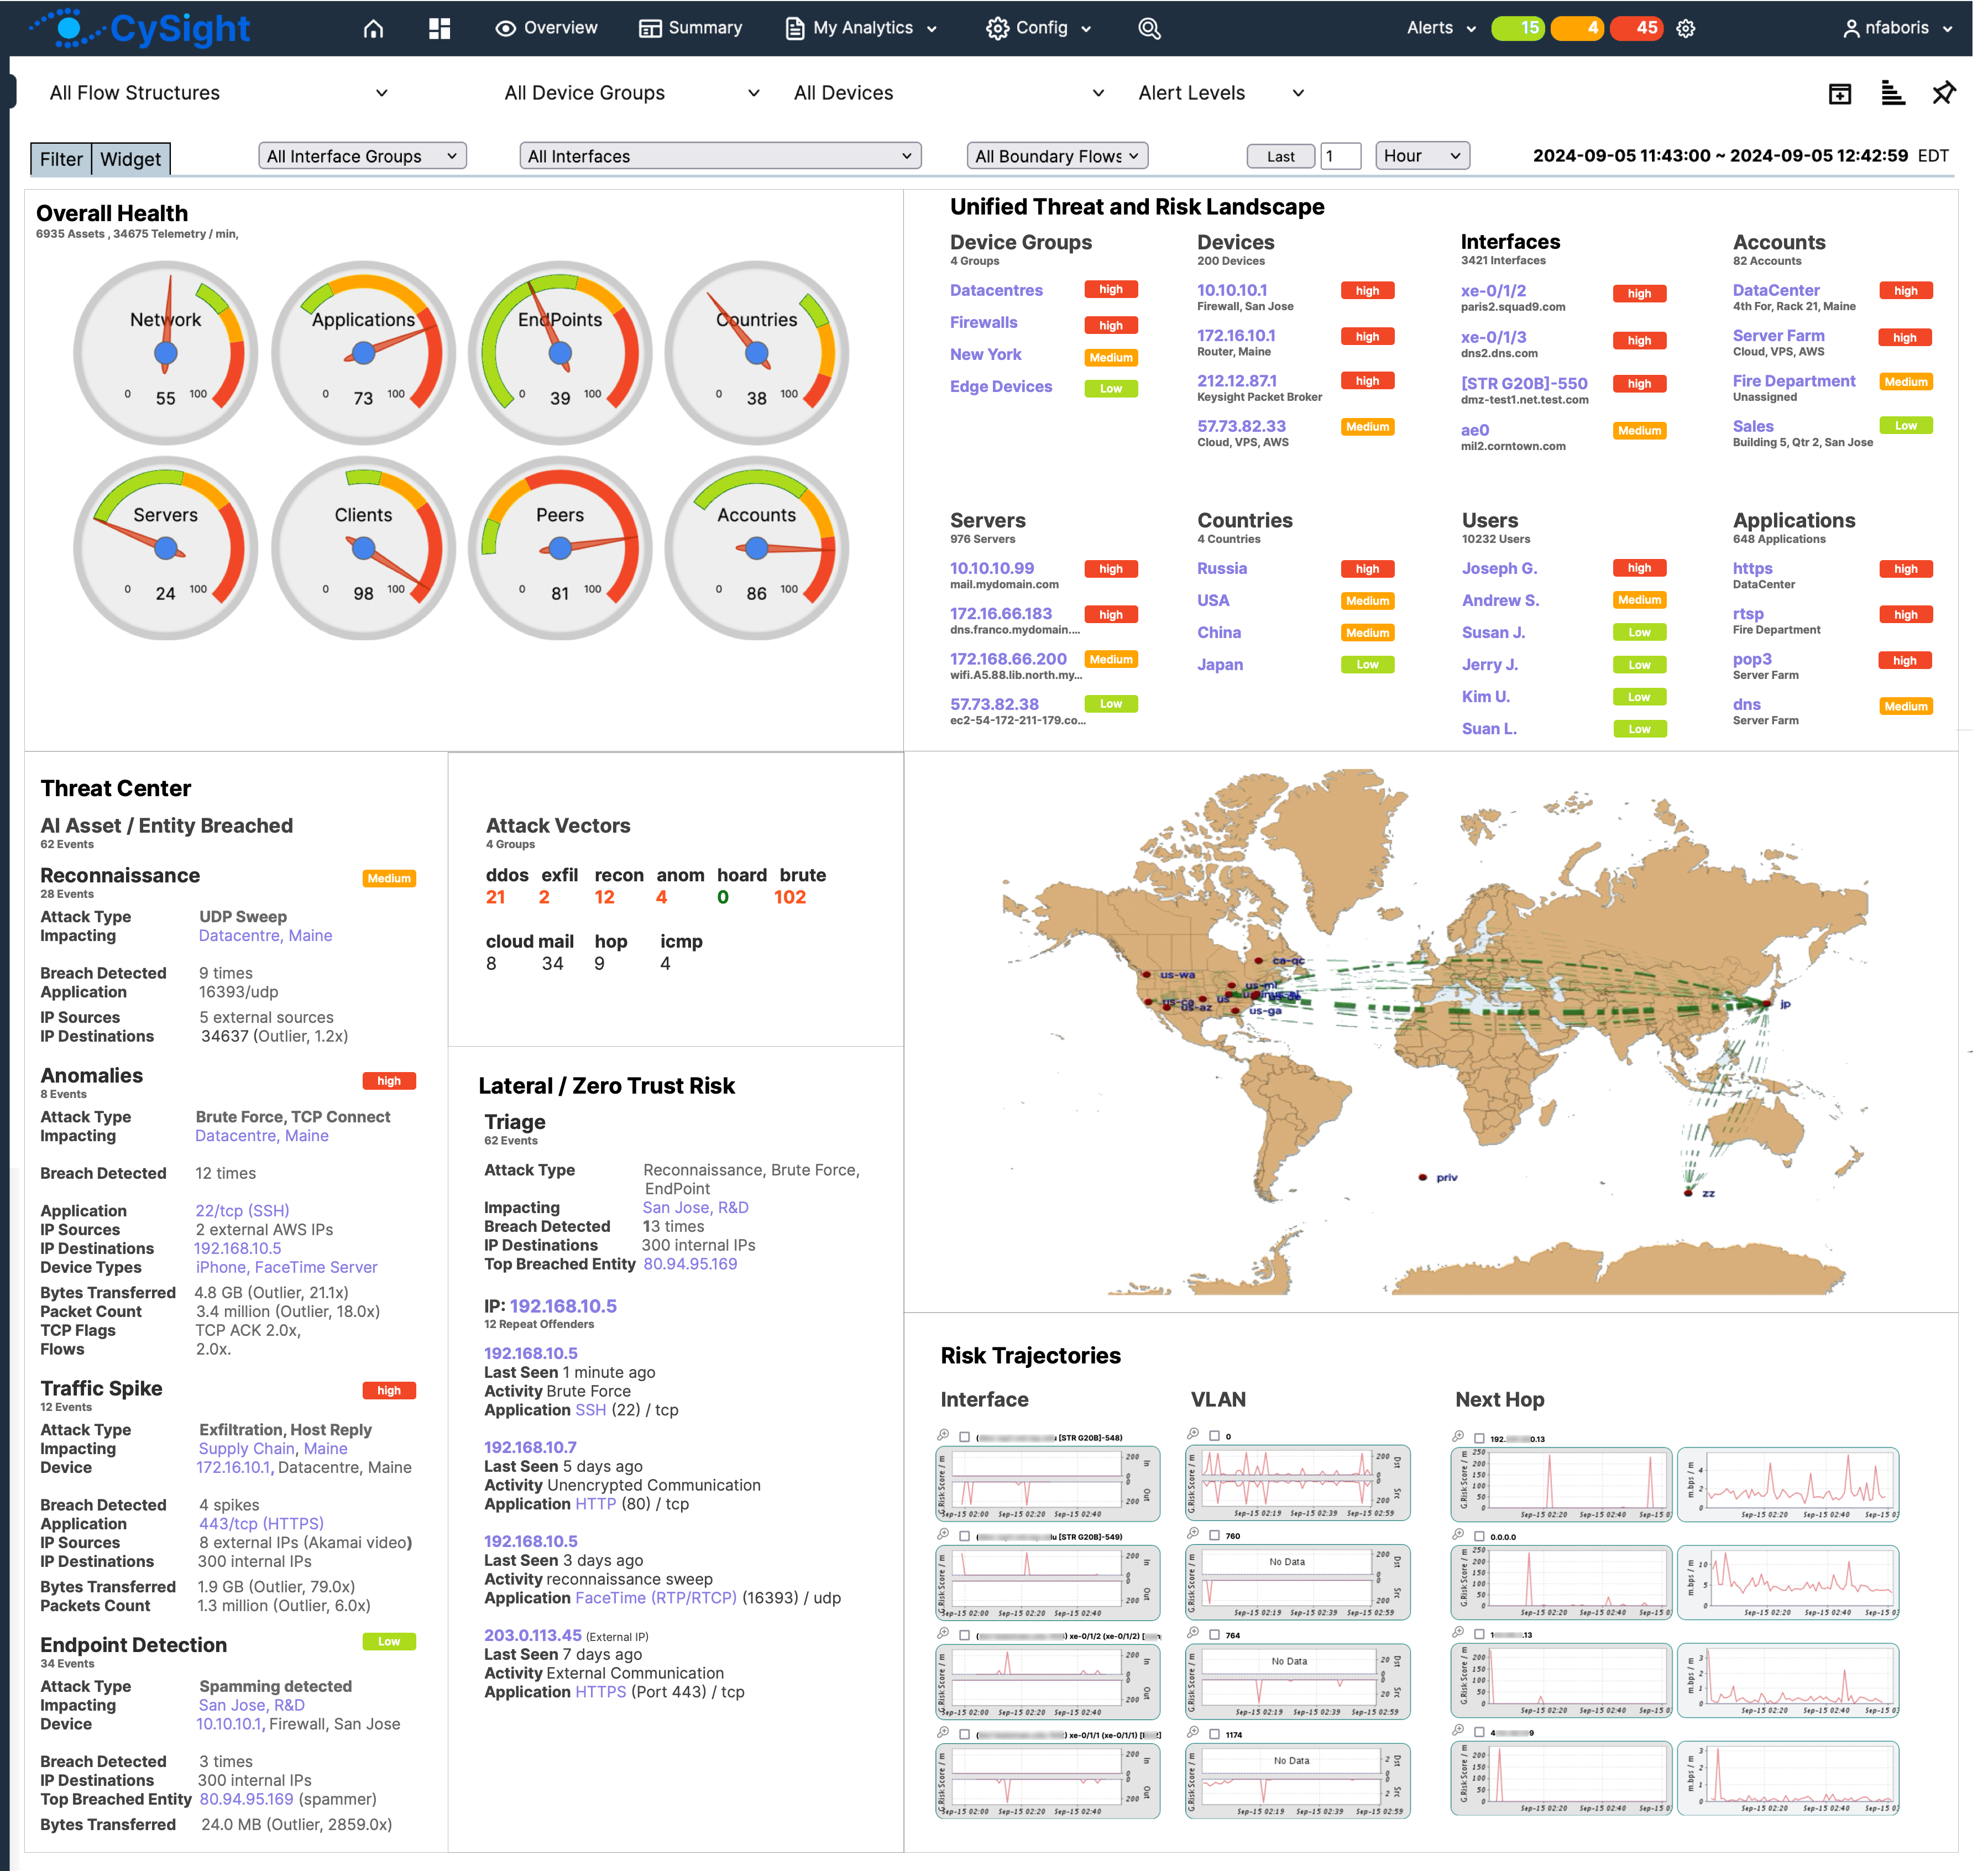
Overall HealthSecurity Analyst Dashboard for diagnostics and remediation
Accuracy and depth, with real-time ML baselines and deviation tracking per category
Click for detailed trends, states, and alerts
Unified Threat
AI-driven threat & risk insights from real-time and historical network data
Correlates diverse network & cloud assets and telemetry, pinpointing exact threat locations & business impact
Threat Center
Immediate visibility into breaches, attack vectors, and lateral movement
Triage threats with detailed attacker behavior insights
One click to security analyst UI for diagnostics and remediation
Map
Visual real-time integration of external threats and internal targets
Instantly identify high-risk activities and traffic flows to stop breaches
Zero Trust
Linked to chart of accounts for asset-level business risk impact analysis on key applications & resources
Risk Trajectories
Visualize how risks progress across network segments (interfaces, VLANs, VPC, next hops,) over time, providing a dynamic view of evolving threats

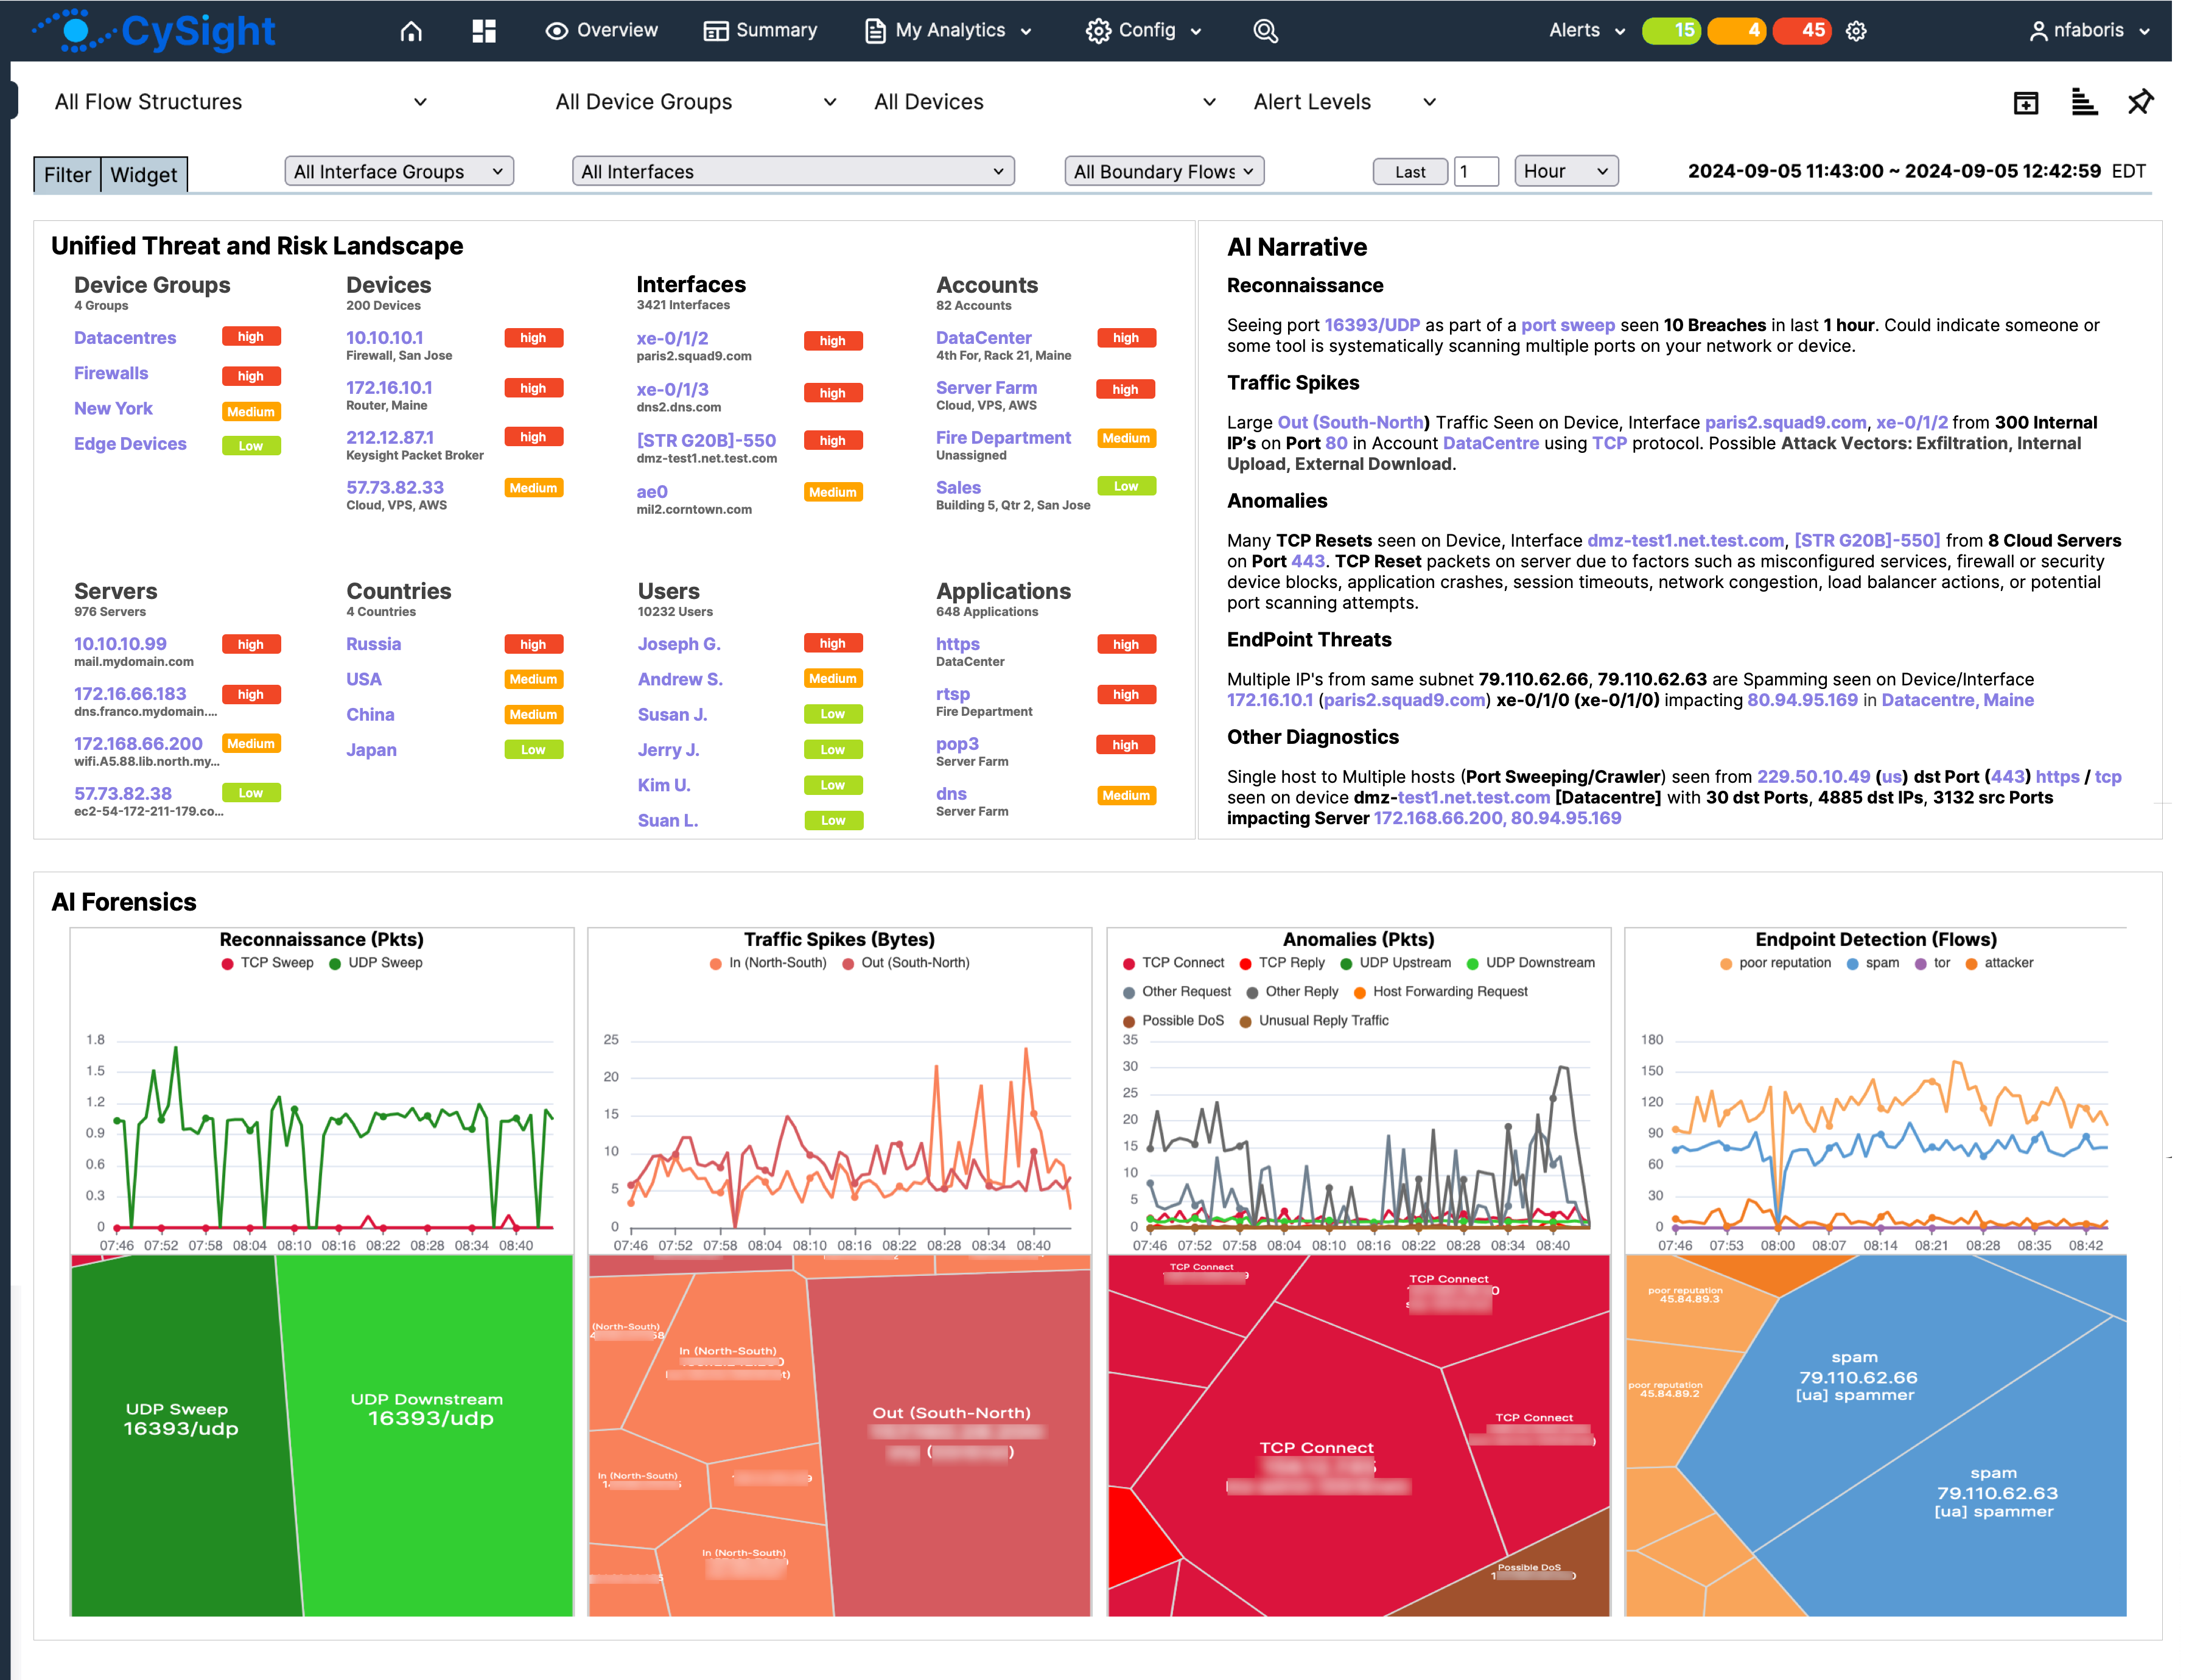
Unified ThreatMapping, Circlepacks, Sankeys and other visualizations can be see here with some useful animations Visualizations,
AI-driven threat & risk insights from real-time and historical network data
Correlates diverse network & cloud assets and telemetry, pinpointing exact threat locations & business impact
AI Narrative
AI-powered, multi-model insights for deep threat forensics
AI Forensics
Real-time, contextual visualizations of threats: reconnaissance, traffic spikes, TCP anomalies, and endpoint risks
Overview

Homepage

Getting Started Additional Notes
Installation, configuration and general usage can be found in CySight Knowledge base with latest documentation guides available on Visual Analytics, Multiviews, Forensics , IPv6 and more.