Click the left menu "Multiview" under "Custom Filter" in "My Analytics" panel, or click the "Filter" icon button on the "Multiview" screen to enter the "Custom Multiview" screen.
Top Toolbar Buttons
- show/hide - show/hide left menu
- Overview - goto device and top interfaces overview page
- Homepage - goto homepage defined in user default option.
- Save - Save the current definition to a template or schedule report.
- PDF - generate PDF report in a separated tab directly.
- CSV - generate CSV report in a separated tab directly.
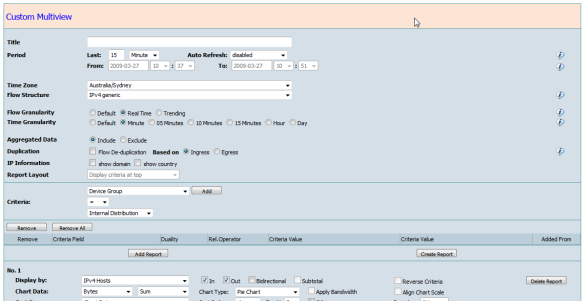
The name of the Multiview report
Period
Defines the period of the Multiview report by two methods
- "Last" N Minute/Hour/Day for real time data, and Hour/Day/Week/Month/Quarter/Year for Trending data.
- "Period" used to select exact calendar period by from and to date time.
The Timezone for the Multiview report period, can be different from the servers time zone.
Flow Structure
This is a Flexible NetFlow feature. Different flow structures are archived separately. CySight currently supports IPv4 and IPv6 generic structures. Multiview does not currently allow the combined view of different flow structure traffic.
Flow Granularity
CySight has 3 kinds of data archives.
- Real Time - high granularity with 1 minute resolution on the front-end.
- Trending - low granularity with minimum 5 minutes resolution.
- Summary - only includes device and interface information fields with down to 1 minute resolution to allow a streamlined and fast query if the report displays and/or criteria only includes the device and/or interface fields.
Both Real Time and Trending data can be configured to any retention period as long as the disk storage allows.Time Granularity
Summary data will be aligned to the longer of Real Time and Trending data.
Defines the statistics time point (resolution or interval) in the report. It can be bigger than the actual resolution of real time or trending archived data.
Aggregated Data
Includes or excludes the traffic after Top N flows.
Duplication
Allows the traffic to be Deduplicated. In cases where the device is to be analyzed on its own all flows are available.
For Deduplication to function correctly physical/logical linkages must be set up among the routers/switches. See Topology setup.IP Information
Will toggle the Display of the domain name and country information when the report has IP fields.
Report Layout
Defines the position of criteria in a generated PDF report.
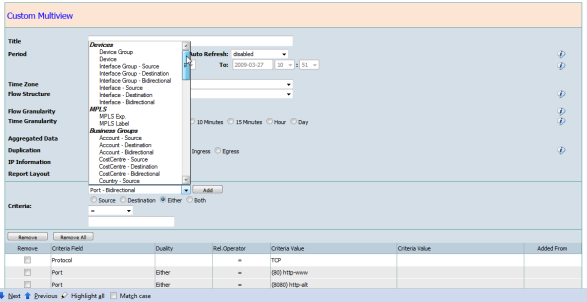
Criteria
Pertains to any raw fields other than measurement in NetFlow. Correlated fields from the raw fields can also be used as criteria. Bidirectional fields e.g. "Interface", "Account", "CostCentre", "ASN", "IP", "Port" etc added to the criteria. Additional initiator and recipient options are available to provide specific inclusion or exclusions eg "Source", "Destination", "Either" or "Both".
- Source - the field value at source side as criteria
- Destination - the field value at destination side as criteria
- Either - the field value at either source or destination as criteria
- Both - the field value at both source and destination as criteria. (only meaningful with "not equal", "not like", or "not between".)
Criteria Notes:
The relationship operator drop down lists are dependent on the criteria field:
* Alike fields can be used multiple times each with its own value and are combined with logic "OR" for example Account = Sales OR Account = HeadOffice OR Account = MyCustomer1.
* Where "not equal", "not like", or "not between" operators are used these will be combined with "AND" logic.
* Different fields criteria are combined with logic "AND".
* The bidirectional field with "Either" operator with bidirectional "Display by" fields will be separated into Inbound and Outbound criteria.
* The criteria will apply to all sub-reports.
Sub-Report
Click "Add Report" to create a sub report.
"Display by"
Drop down list provides the predefined NetFlow field or correlated field or combination of them.
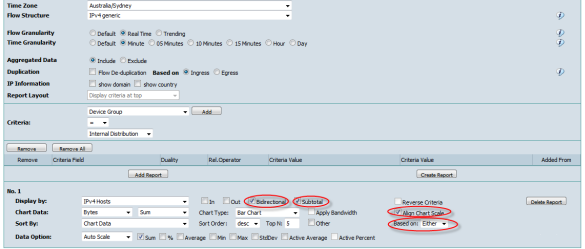
"In"/"Out" "Bidirectional"
Options are for bidirectional fields, e.g. "Interface Group", "Interface", "Account", "Cost Center", "AS", "IPv4"/"IPv6", "Port".
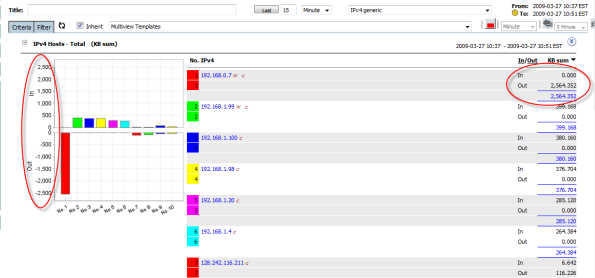
When "Bidirectional" is ticked on, then the sub-report will match and combine "Top In" and "Top Out" traffic together, and enable the following options.
- "Subtotal" - aggregate of "In" and "Out" values.
- "Align Chart Scale" - set the same scale for "In" and "Out" values in the chart.
- "Based on" - Sorting according to "In", "Out" or "Either" traffic.
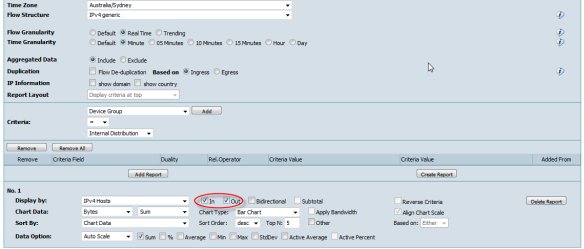
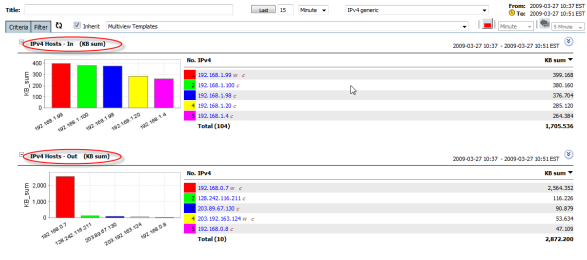
When "In" and/or "Out" are ticked on, then the "Top In" and "Top Out" traffic will be separated, and "Subtotal", "Align Chart Scale" and "Based on" will be disabled.
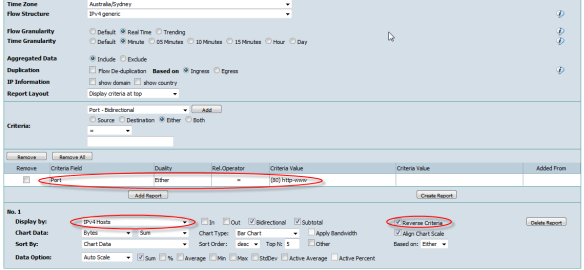
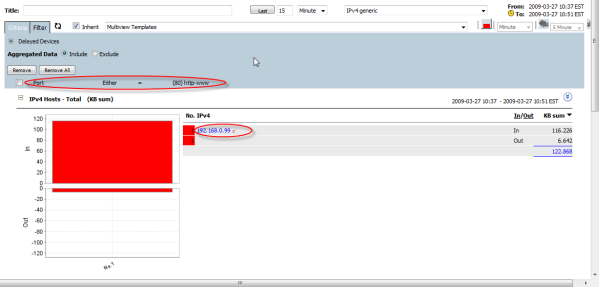
When a Bidirectional "Either" criteria is used concurrently with "Display by" that includes bidirectional fields, then the "Reverse Criteria" checkbox option becomes available. For this case, the "Either" will be separated as "In" and "Out" criteria corresponding to the "Display by" bidirectional "In" and "Out".
If the "Reverse Criteria" is ticked on the separated criteria then "In" will match to "Display by" "Out" and "Out" will match to "Display by" "In".
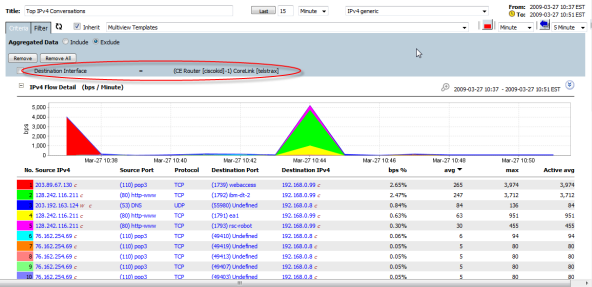
In the following example, the IP of the client side of web/http traffic is displayed when "Reverse Criteria" is ticked on. When unticked the IP would be the Web server.
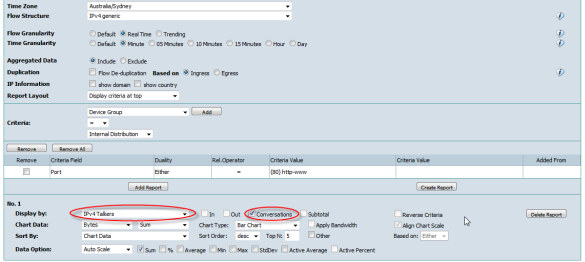
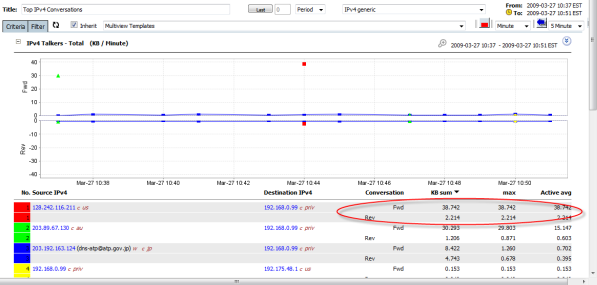
The "Conversations" option becomes available when "Display by" includes both Source and Destination fields, e.g. "IP Talker" (SourceIP and DestinationIP). The sub-report will match and combine "A->B" and "B->A" together.
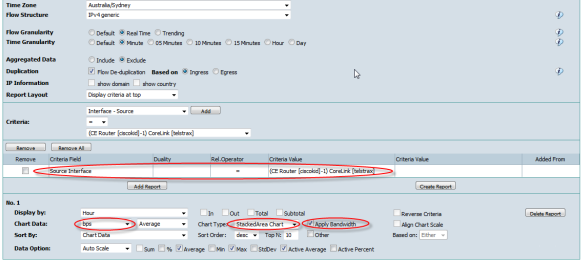
"Chart Data"
Defines the netflow traffic measurement - Bytes, bps, Packets, pps, Packets, Flows and TcpFlags.
Chart data allows various values of measurement including Sum, Percentage, Average, Min, Max, StdDev and Active Average.
Whats the difference between Active Average and Average?"Chart Type"
Active Average is the average taken from only the periods where data has been active.
Average is the average on all period time points including all time points where no data has been active i.e including all time points where the data is zero for the query.
Note:
"Count" measurements are only supported in Forensics analytics.
Supports:
- Pie(3D) chart,
- Bar(3D) chart,
- Stacked Bar(3D) chart (if two fields),
- Time Chart,
- Stacked Area chart, and
- Statistics chart
If "Display by" is Day or Hour field. Chart type can be "no chart"."Apply Bandwidth"
Is available for stacked area charts when the measurement is "bps" and bandwidth can be located in criteria like Interface or Interface Group.
"Data Option"
Defines which statistics values are added to the sub-report grid.