CySight provides a number of tools that allow you to perform root cause analysis and security Forensics with simple sophistication.
Report period
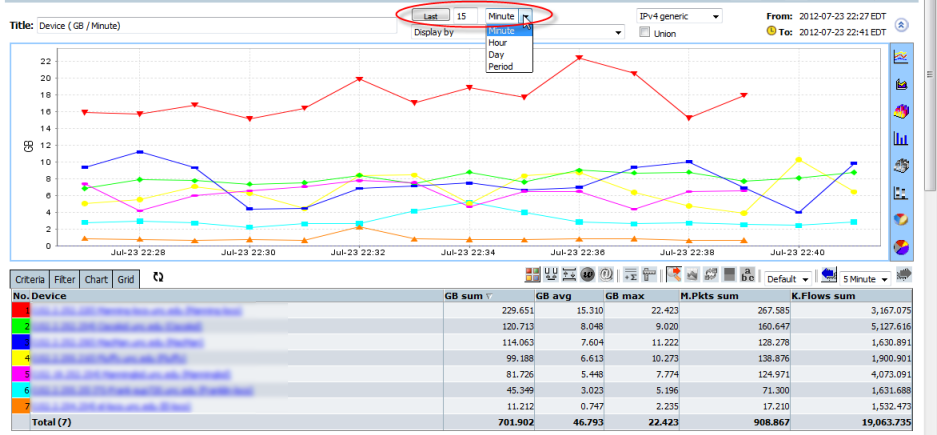
Enter a Period in "Last N" and/or change period type.
- Minute - N minutes from the latest minute backward.
- Hour - N hours from the latest minute backward.
- Day - N Days from the latest minute backward.
- Week - N Weeks from the latest minute backward.
- Month - N months from previous day backward.
- Quarter - N quarters from previous day backward.
- Year - N years from previous day backward
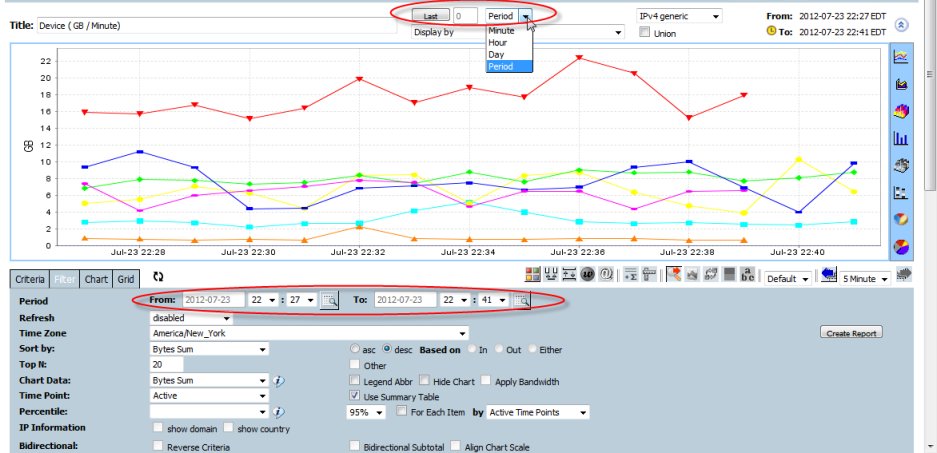
When changing the period type to "Period", the "Filter" tab will be opened.
Choose the exact time period between the From and End and click "Create Report" button to rebuild the report with defined period.
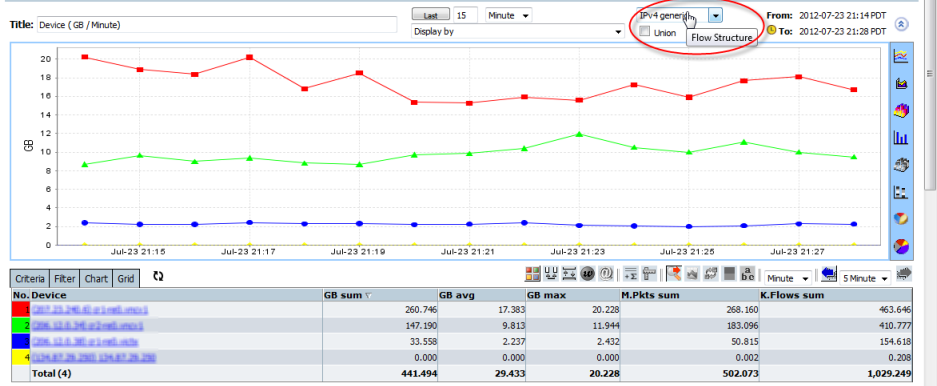
IPv4 and IPv6 toggle
The IPv4 and IPv6 radio option or the "Flow Structure" dropdown option at the top of the screen allows the user to quickly switch between IPv4 and IPv6 flow data whilst retaining all other options and maintaining the compatible criteria.
Where criteria and/or "Display by" fields contain IP fields, the Forensics report will revert to the "Custom Forensics" screen when swapping between IPv4 and IPv6.
When the "Union" option is ticked it will combine different flow structures traffic together.
Quick Search
The quick-search toolbar at the top of the screen allows a quick look up of Devices, Interfaces, Protocols, IPs, and/or Ports.
Devices and Interfaces allow matching using the '%' wildcard character.Toolbar Buttons
It is not necessary to use '%' at the beginning or end of a search term.

- "show/hide" - Allows the left menu to be revealed or hidden.
- "Overview" - Open the Interfaces Bandwidth Utilization overview page.
- "Homepage" - Opens the Default Homepage (configurable in My Analytics panel > Default Options).
- "Filter" - Opens the "Custom Forensics" screen with all the criteria of the current report.
- "Save" - Allows the current "Forensics" and criteria to be saved as;
- "PDF" - generates a pdf report of the current analysis.
- "CSV" - generates a csv report of the current analysis.
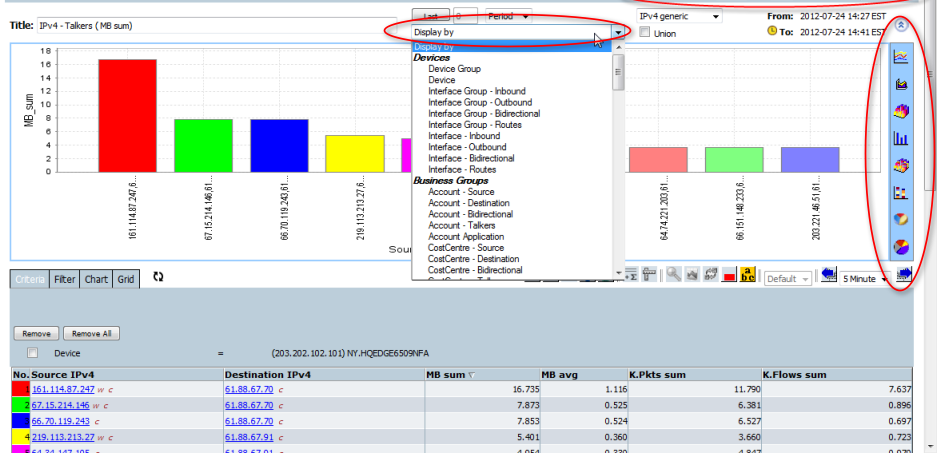
"Display by" will generate a new report based on the perspective of the display selected whilst retaining the current period, criteria and all other options.
PageUp, PageDown and Page Total
Forensics displays the total available items for criteria and period on the top right of the page. Even though the chart and grid only displays the Top N items, clicking on PageUp and PageDown displays the next or previous data.
Chart Type
The icons to the right of the chart allow different chart types to be displayed for the Forensics report criteria.
Available Chart types are:
 Line Time Chart - Displays a comparative line chart of all elements
 Stacked Area Time Chart - Displays an aggregated line chart of all elements
 3D Bar Chart - Displays a comparative total of the data.
 Bar Chart - Displays a comparative total of the data.
 3D Stacked Bar Chart - Displays a stacked view of graphs with 2 dimensions.
 Stacked Bar Chart - Displays a stacked view of graphs with 2 dimensions.
 3D Pie Chart - Displays a comparative total of the data.
 Pie Chart - Displays a comparative total of the data.
When the data is bidirectional Pie Chart will show two graphs reflecting In and Out.
Forensics Icons
Most of icons under the chart are quick toggle buttons to make the Forensics report easy to use.

 Automatic Refresh - Toggle on/off automatic refresh.

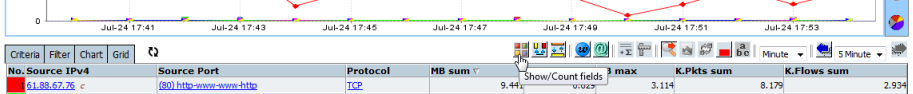
- Show/Count fields - Three state toggle. Useful in Intelligent Baseline Anomaly Detection views to quickly contextualize the baseline which is by default in "count all fields" mode. The toggle reflects the current mode state.
 show all fields
 count all fields
 count one field

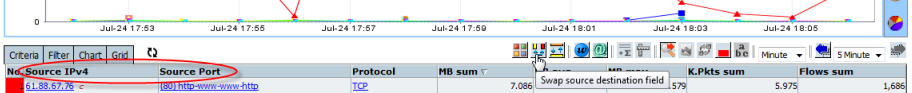
 Swap source destination field - Change the "Source" fields to corresponding "Destination" fields, and the "Destination" fields to corresponding "Source" fields in the grid "Display by" fields.

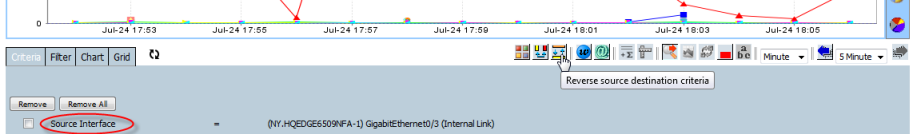
 Reverse source destination criteria - Change the "Source" fields to corresponding "Destination" fields, and the "Destination" fields to corresponding "Source" fields in criteria.
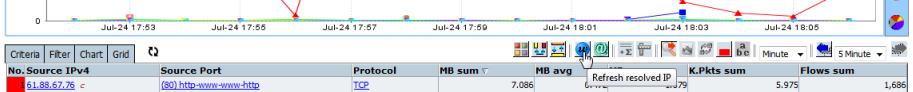
 Refresh resolved IP - Redo the DNS reverse lookup for the IPs in the report.

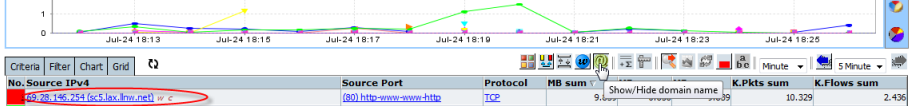
 Show/Hide domain name - Toggle on/off domain name display.
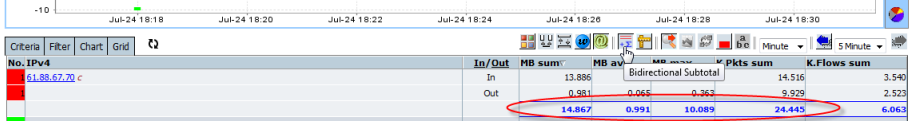
Bidirectional Subtotal - Toggle on/off display of subtotals for bidirectional In and Out traffic.
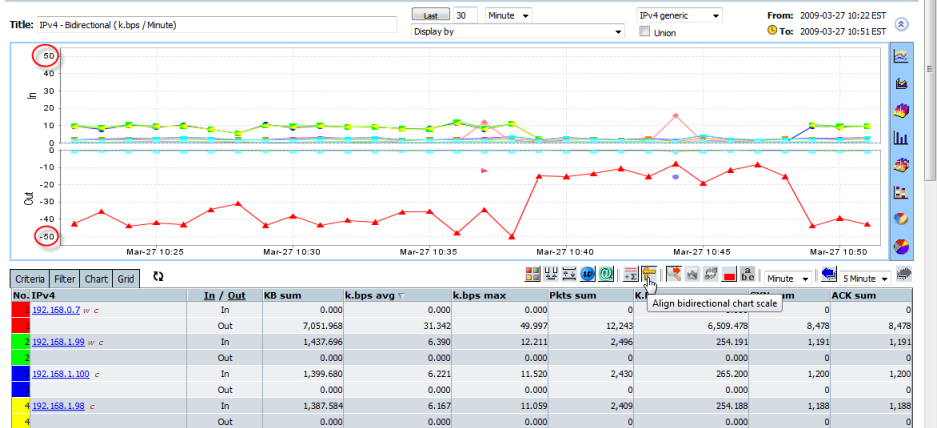
 Align bidirectional chart scale - Toggle on to equalize the scale on a bidirectional In and Out chart.
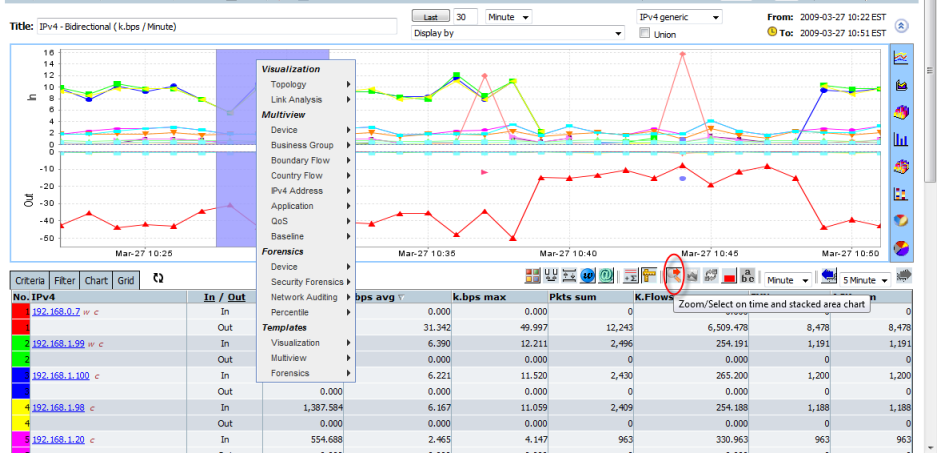
- Zoom/Highlight drill down - Available for Line Time Chart and Stacked Area chart. The toggle reflects the current mode state.
 Zoom Mode - Mouse drag will zoom into chart
 DrillDown Select Mode - Mouse drag will highlight part of chart to allow drill down to a sub-period
After selecting a Zoom area with zoom mode return to current view by Left-click+Drag on the graph and releasing and the graph should return to a maximum view of the data.
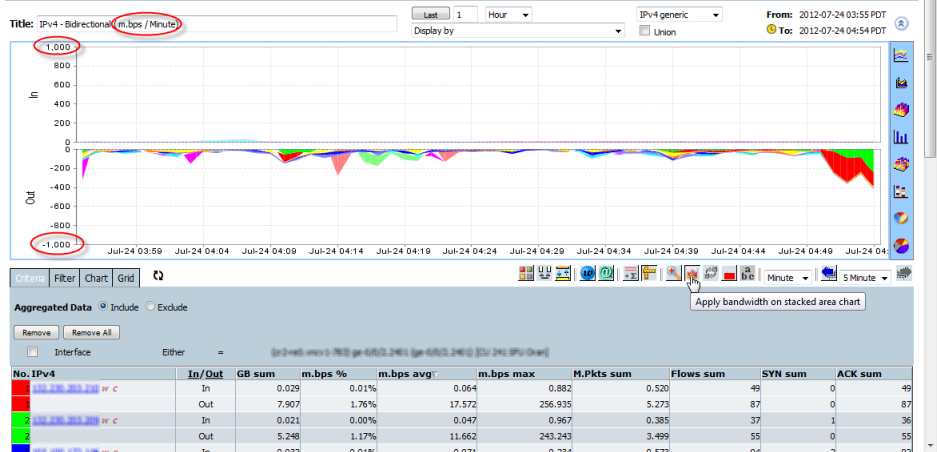
 Apply bandwidth on stacked area chart - Toggle on sets the bandwidth to the actual bandwidth on stacked area chart when Interface or Interface Group is added to criteria. Must be in stacked area chart display mode to function.

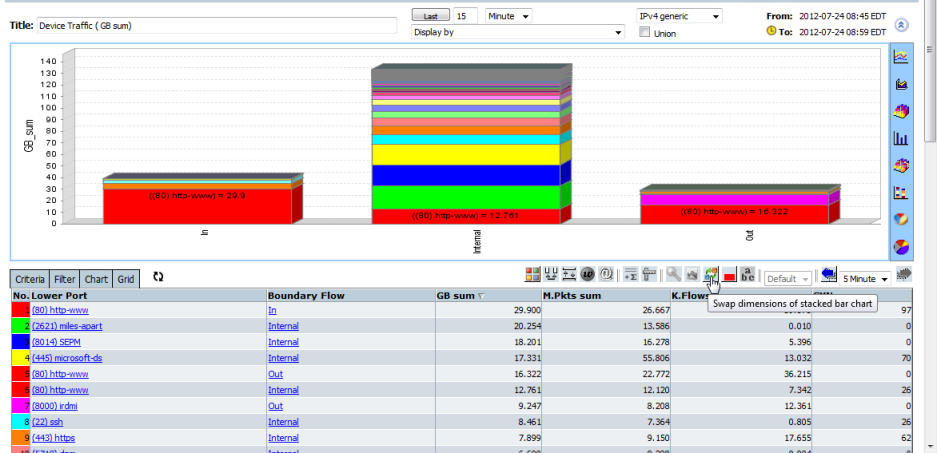
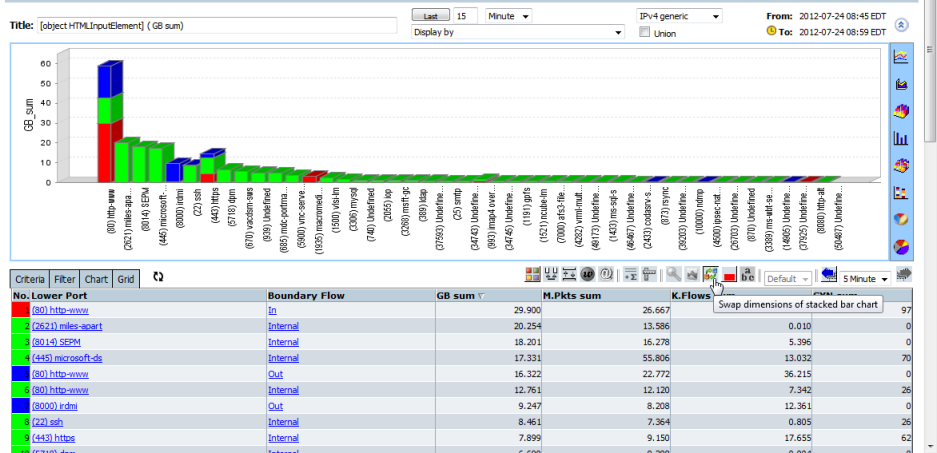
 Swap stacked bar chart dimensions - Only available when 2 dimensions have been chosen.

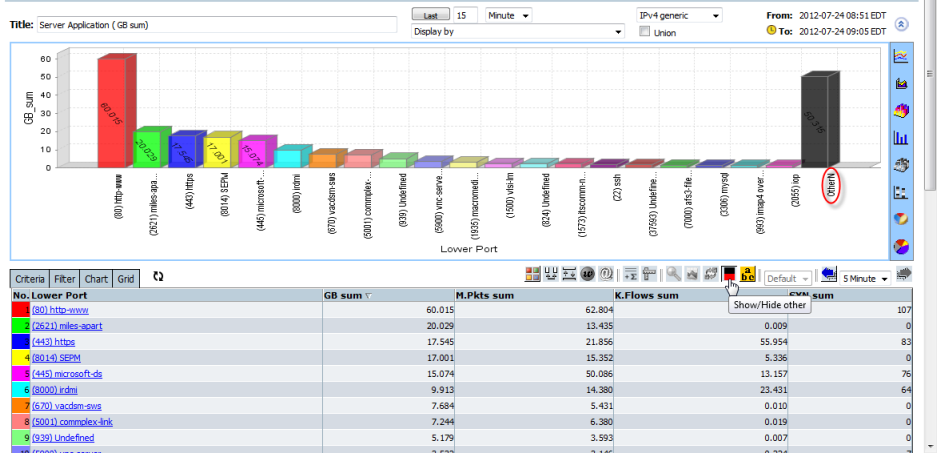
 Show/Hide other - Toggle on/off Other.
If a report was not initially built with Other the report has to be rebuilt including the Other statistic.
Leaving Other off is a useful way to speed up a Top N queries but does limit Bandwidth Utilization views.

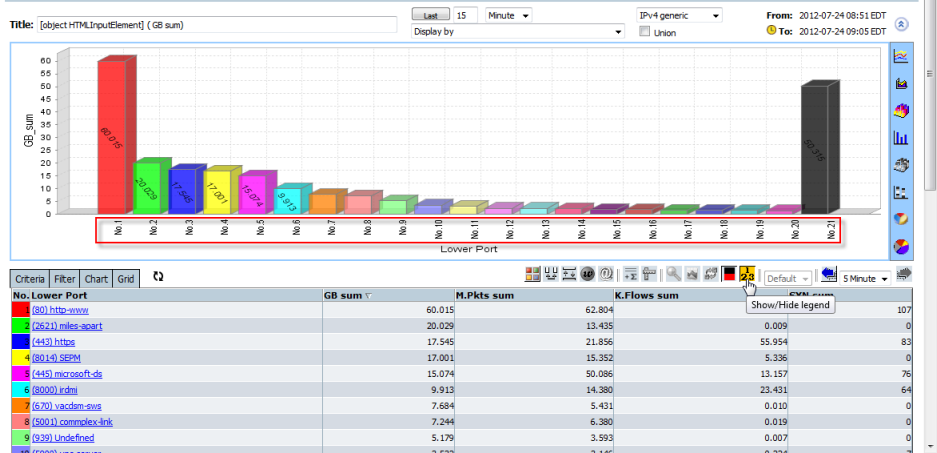
 Show/Hide legend -Toggle on/off to display the Chart Item legend or a Sequence Number on the graph. Using a sequence number makes the graph easier to read when more than one dimension or the dimension is large.

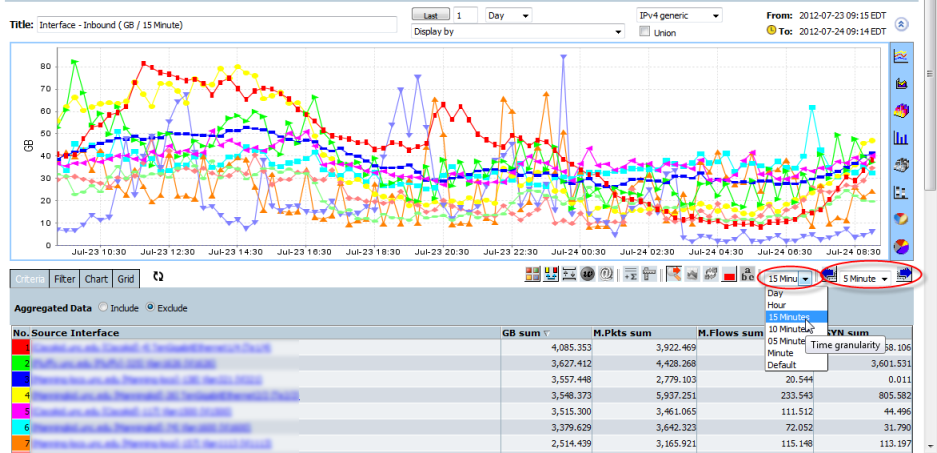
Allows the time resolution to be changed for the current report. Changing the time granularity will cause the report to be rebuilt.
Time Shift
Enables the period window to be shifted back or forward in time in increments of the time step defined.


Show hide/graph
Enables the graph to be hidden to allow focus on the grid.
Grid Functions
Re-Sort on Grid Header
The triangle on the grid header shows which column is currently being sorted.
Clicking on the grid header will re-order the grid based on that column. It will toggle ascending and descending if the order is already based on that column.
Clicking on a bidirectional In/Out column will follow a three way toggle ordering by;
- Either,
- In, or
- Out
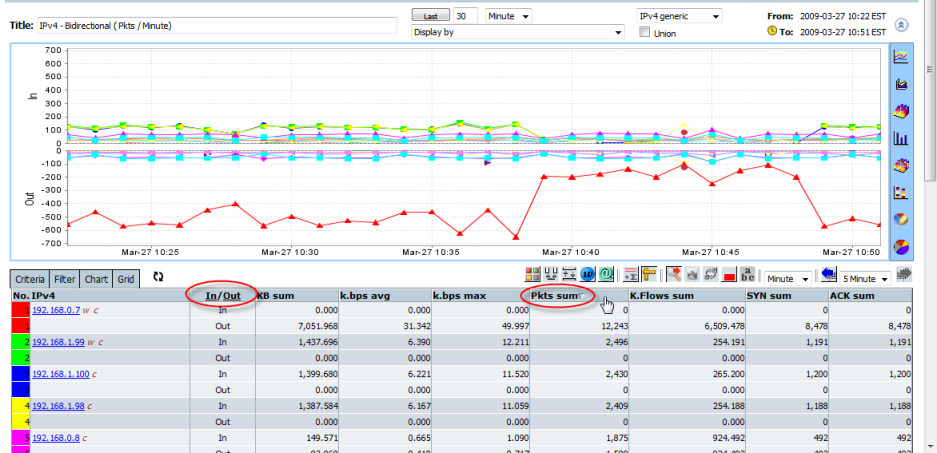
Only the current report grid elements will be ordered and the data will not be re-queried. Therefore in order to see a true Top N for a where the number of elements in the current query exceed the display the report should be re-queried from the Filter Tab below the graphSingle Click the Grid Column Item
Selecting the grid column item with a single left-click will add the item value as a criteria and drill down to the flow detail.
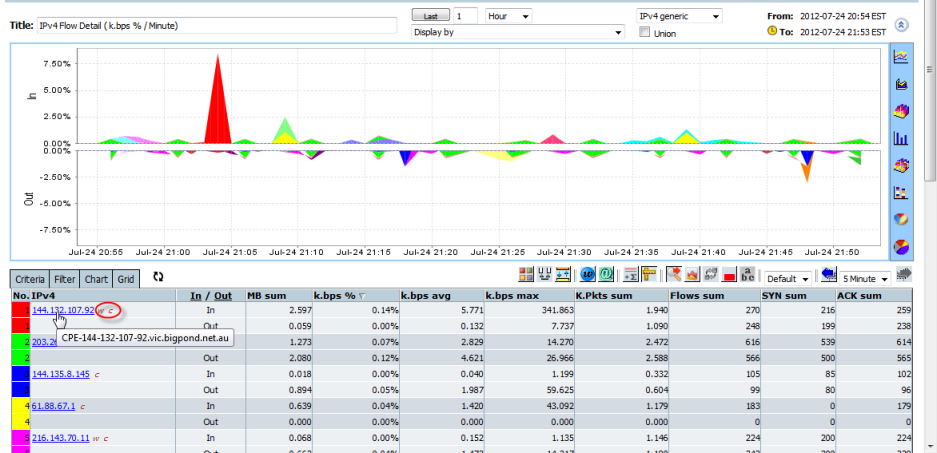
Single Click the IP Address 'w' tag
The 'w' after an IP address indicates that the corresponding IP domain has been resolved. Clicking on the 'w' will drill down to all the IP Port conversation with the domain name as the criteria. No other criteria or time period will be inherited.
Single Click the IP Address 'c' tag
Clicking on the 'c' will drill down to all the IP Port conversation with the IP Address as the criteria. No other criteria or time period will be inherited.
Right Click on Grid Record
The grid allows the grid line record to launch popup menu by means of a right-click to drill down when the chart is hidden by the
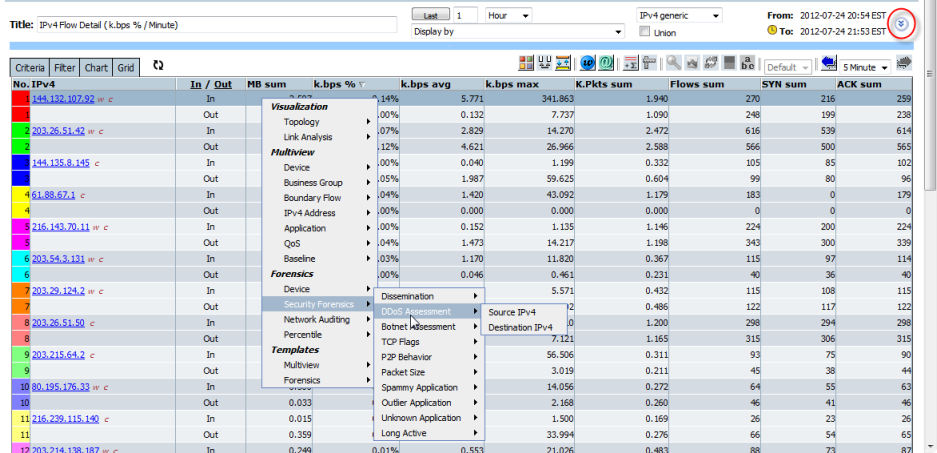
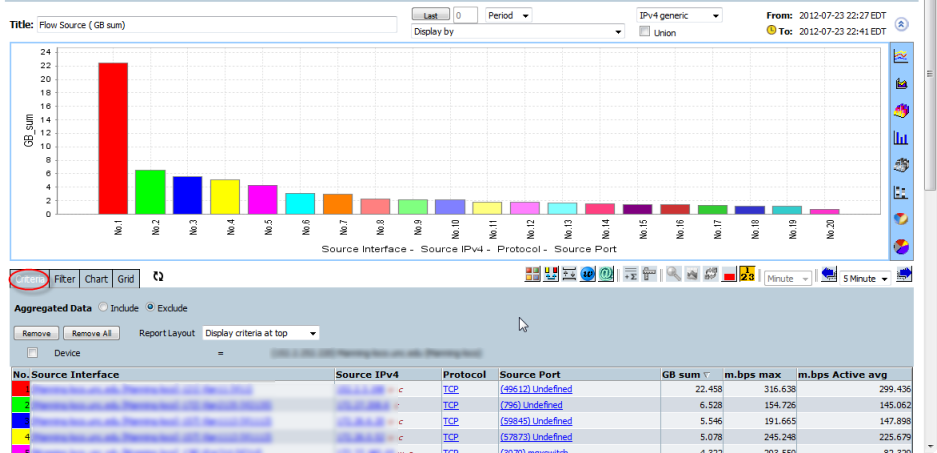
Criteria Tab
The Criteria Tab shows the criteria of the current display.
As you drill into the graphs the criteria will be inherited for each period highlighted or chart or grid item selected.
Clicking the
- Aggregated Data - Rebuilds the report including or excluding aggregated data whilst retaining the current period and criteria, refer to "Custom Forensics" about the "Aggregated Flow". Aggregated Flow shows when CySight is running in Top N mode (aka Performance) and does not show when using CySight in full flow archive mode (aka Professional).
- "Remove"/"Remove All" - Rebuilds the report with the ticked criteria removed.
Filter Tab
The filter tab provides a subset of options that are found and explained in the "Custom Forensics" screen.
These can be customized to quickly rebuild the report without having to open the "Custom Forensics" screen.
Where possible the Forensics Icons have been created to simplify the use of the Filter Tab or the need to use the "Custom Filter". The Forensics Icons will have a corresponding checkbox option in the Filter Tab.
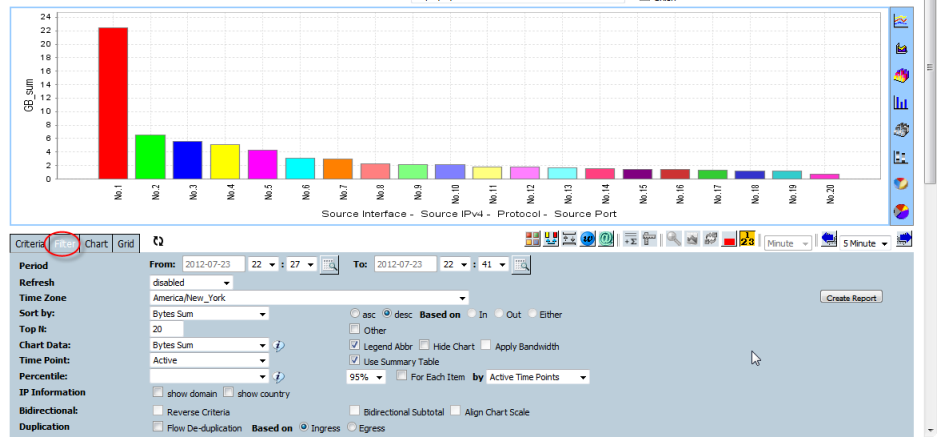
Chart Tab
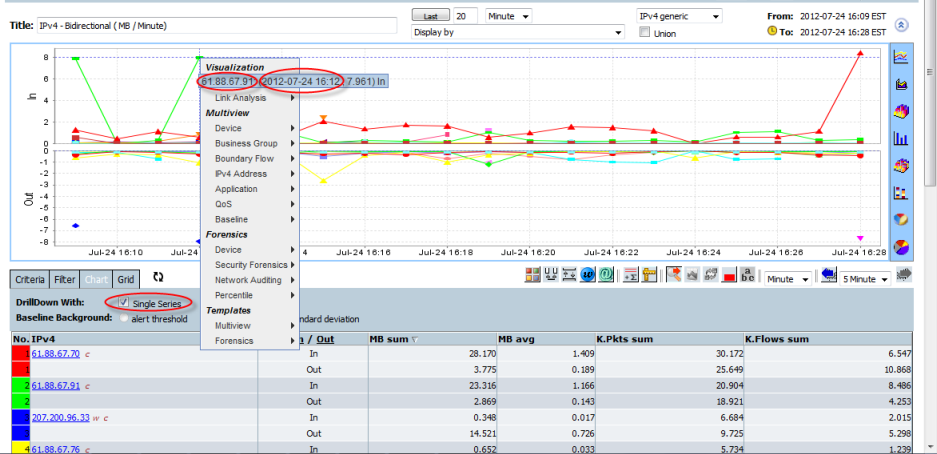
- Drilldown with Single Series - Double click or right click on a time chart point or a stacked chart area to launch the popup menu to drill down.
Ticked - The time period and selected chart series will be inherited as the criteria
UnTicked - Only the time point will be inherited as criteria
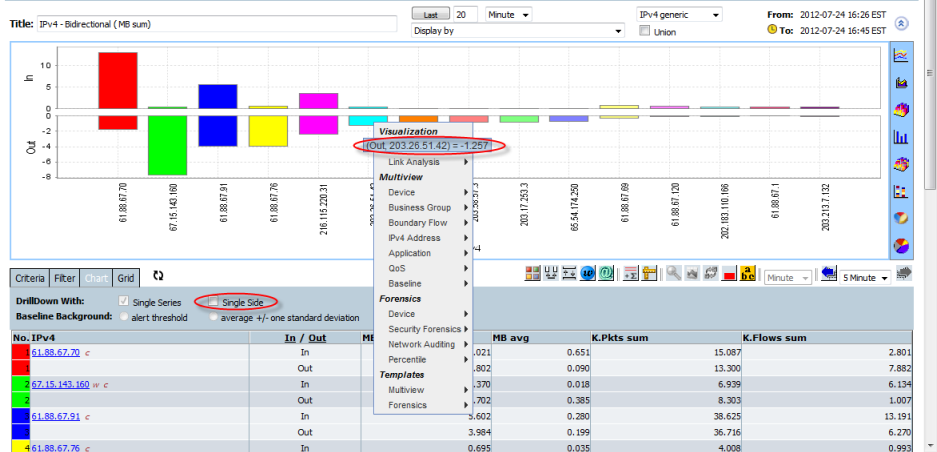
- Drilldown with Single Side - Double click or right click on a time chart point or a stacked chart area to launch the popup menu to drill down
Ticked - Selecting one side of a bidirectional "In" or "Out" view will inherit the "Source(Out)" or "Destination(In)" as the criteria.
UnTicked - "Either" becomes the inherited criteria.
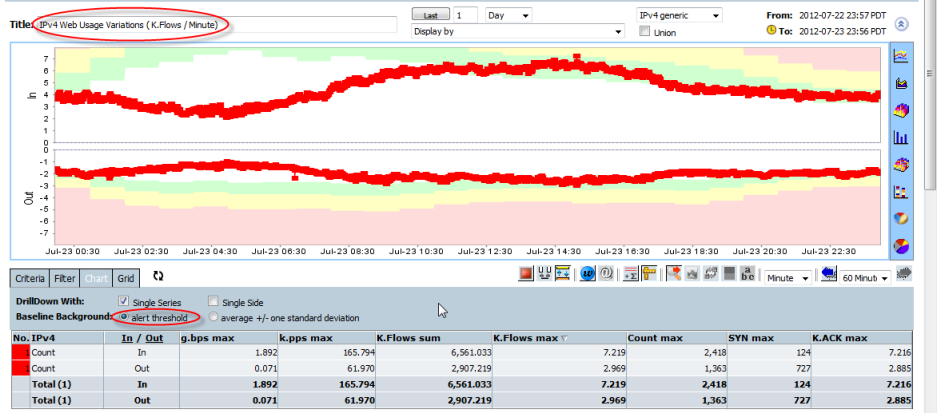
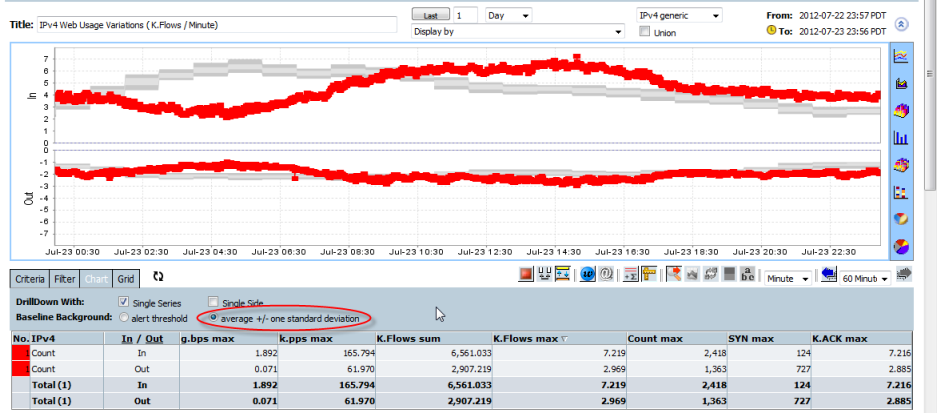
Extended Anomaly Detection Baseline Options - Baseline Background - When a baseline has been learned for a set of criteria the baseline can be displayed together with the current traffic.
- "alert threshold" - Display the data against the preset threshold or learnt baseline and correlated against the Information (Green), Warning (Yellow) and Critical (Red) settings for the by minute alert criteria.
- "+/- one standard deviation" - Display the data against the preset threshold or learnt baseline and correlated against the plus or minus one standard deviation by minute criteria.
- "alert threshold" - Display the data against the preset threshold or learnt baseline and correlated against the Information (Green), Warning (Yellow) and Critical (Red) settings for the by minute alert criteria.
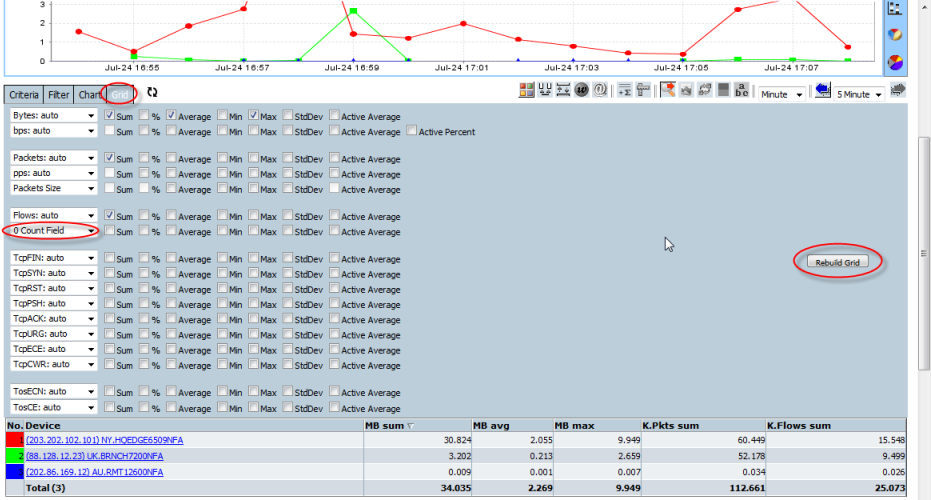
Allows you to select the measurement fields to display side-by-side on the forensics report. The drop-down list boxes allows you to specify the scale for each measurement or allow auto scaling.
- Select the measurements statistics values to display.
- Click the "Rebuild Grid" button to add the ticked value to report grid.
The "Rebuild Grid" will be processed by the client browser as long as the "Count" option is not changed, otherwise the report will be regenerated by the CySight Server.