Most of the Period and Criteria parameters are compatible with Multiviews and Visualization allowing drill down between them.Click the left menu "Forensics" under "Custom Filter" in "My Analytics" panel, or click the "Filter" icon button on the top toolbar in the "Forensics" screen to enter the "Custom Forensics" screen.
Toolbar Buttons

- "show/hide" - Allows the left menu to be revealed or hidden.
- "Overview" - Open the Interfaces Bandwidth Utilization overview page.
- "Homepage" - Opens the Default Homepage (configurable in My Analytics panel > Default Options).
- "Filter" - Opens the "Custom Forensics" screen with all the criteria of the current report.
- "Save" - Allows the current "Forensics" and criteria to be saved as;
- "PDF" - generates a pdf report of the current analysis.
- "CSV" - generates a csv report of the current analysis.
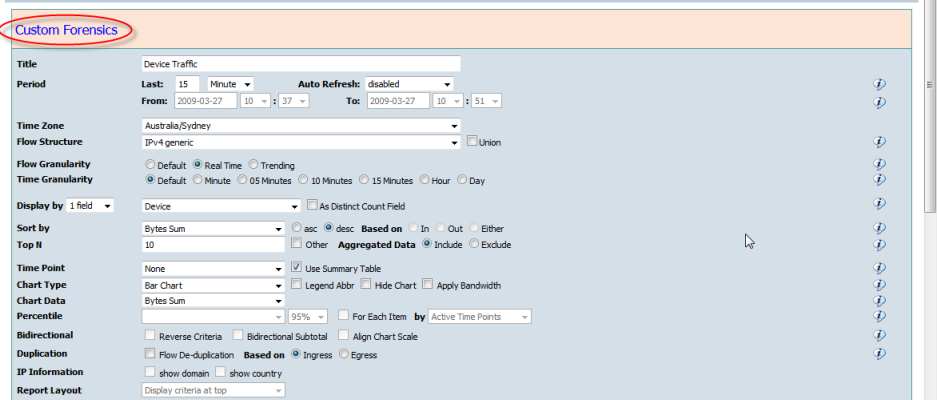
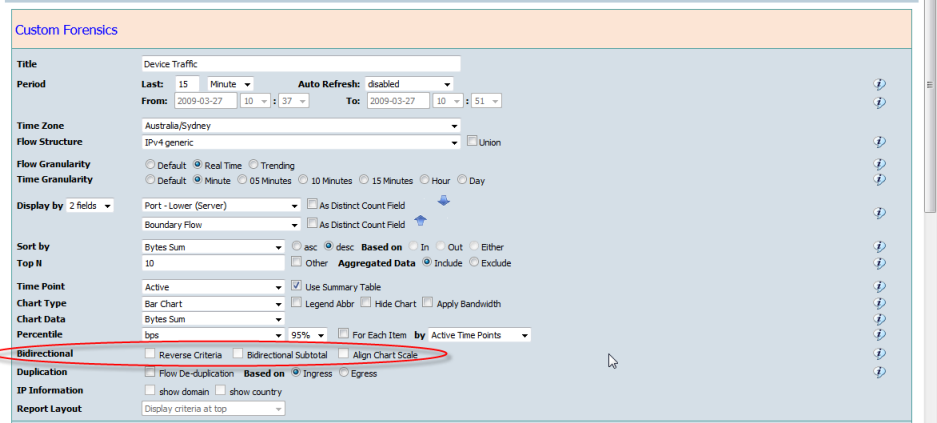
Custom Forensics Parameters
Title
Name of the Forensics report.
Time Period
Selecting "Last N" queries the most current data backwards for the period selected
- Minute - N minutes from the latest minute backward
- Hour - N hours from the latest minute backward
- Day - N Days from the latest minute backward
- Week - N Weeks from the latest minute backward
- Month - N months from previous day backward
- Quarter - N quarters from previous day backward
- Year - N years from previous day backward
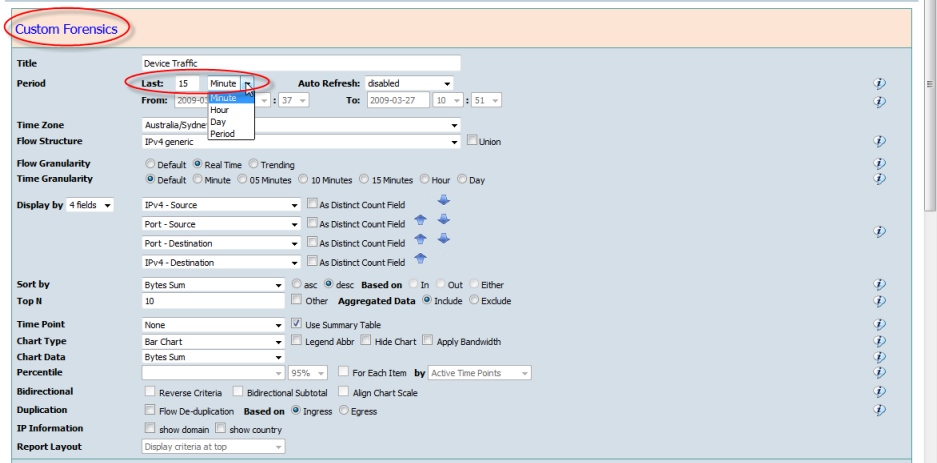
Selecting "Last Period" enables the time fields. Select the exact time period between the From and End.
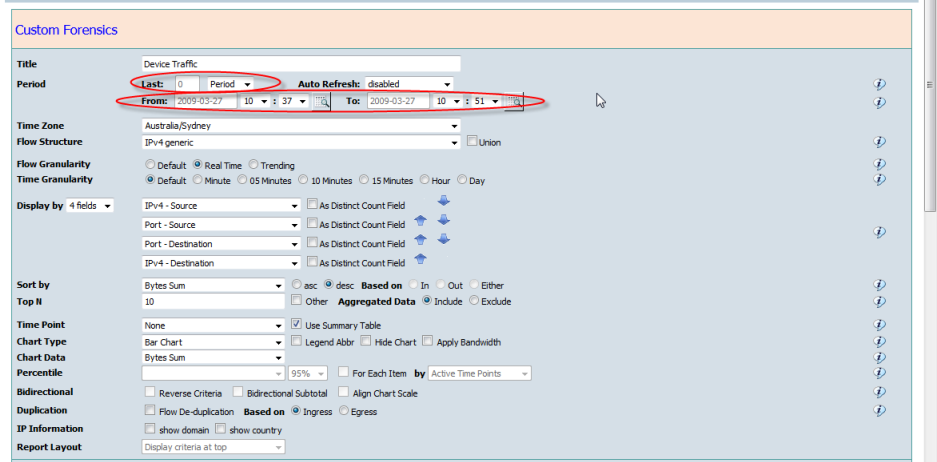
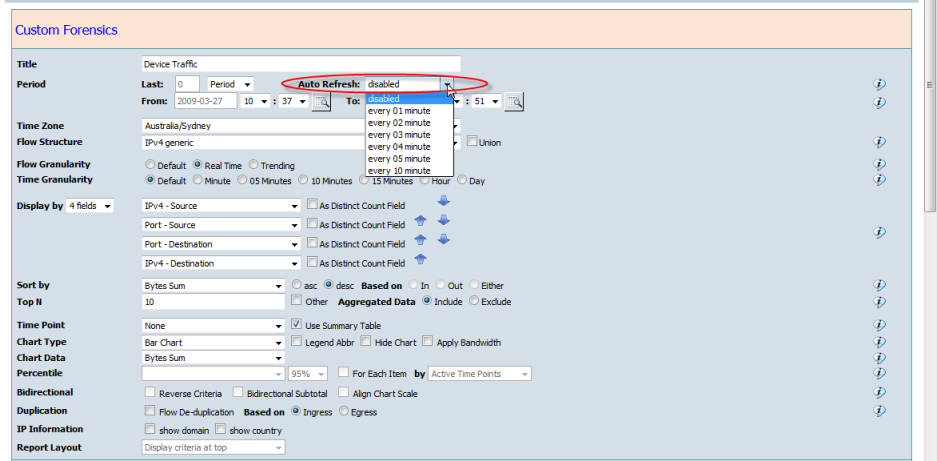
Auto Refresh - Defines the automatic refresh interval for the Forensics report.
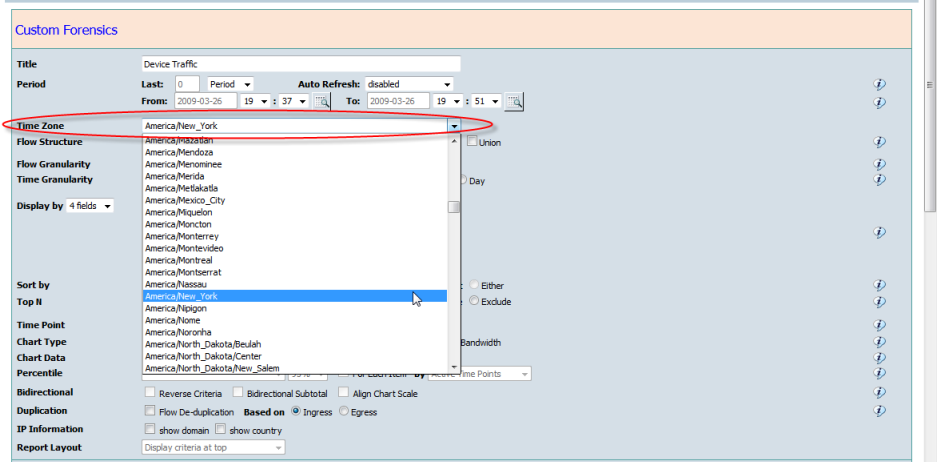
Time Zone - Allows the report to display times for the selected time zone perspective.
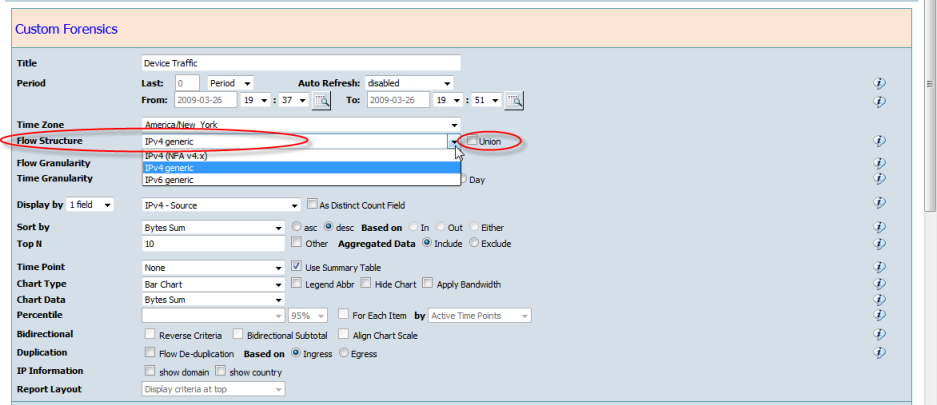
Flow Structure - Different flow structures are archived separately to reduce archive data size.
CySight currently supports IPv4 and IPv6 generic structures. Ticking "Union" will combine different flow structure traffic together in Forensics views.
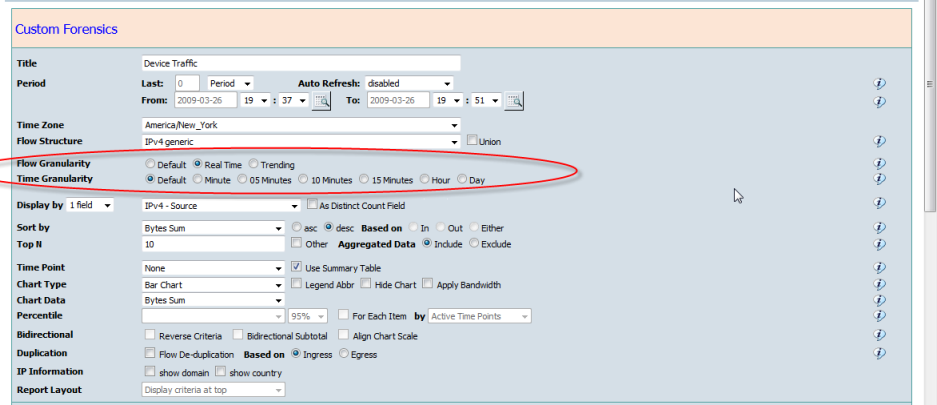
Flow Granularity - CySight retains data in a number of archives.
- Real Time - high granularity with 1 minute resolution.
- Trending - low granularity with minimum 5 minutes resolution.
- Summary - only include device and interface information field with down to 1 minute resolution to faster the query if the report only include device and/or interface field. Summary data will be align the longer one of Real Time and Trending data.
If "Default" is ticked on then CySight will automatically select "Real Time" or "Trending" according to the time period.
Both Real Time and Trending archives can be configured using Data Collection Tuning to retain any period subject to available disk storage.
Trending archive is only available after installing a Long-Term Trending license and also by enabling and confirming the "Process Trending Data" checkbox in the Configuration > Management > Administrator > Site Configuration screenTime Granularity - Defines number of time-point intervals to display on time and stacked area report charts. The interval can be larger than the data resolution of the real time or trending archives.
If "Default" is ticked on then CySight will automatically select a time resolution according to the length of the time period.
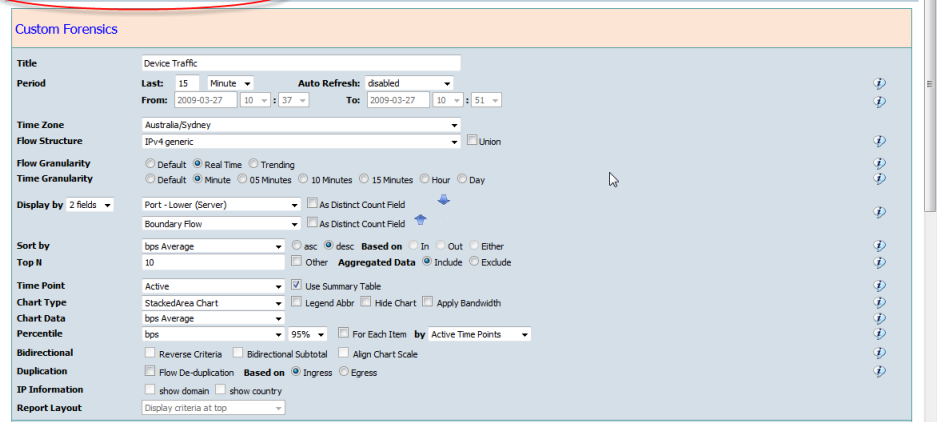
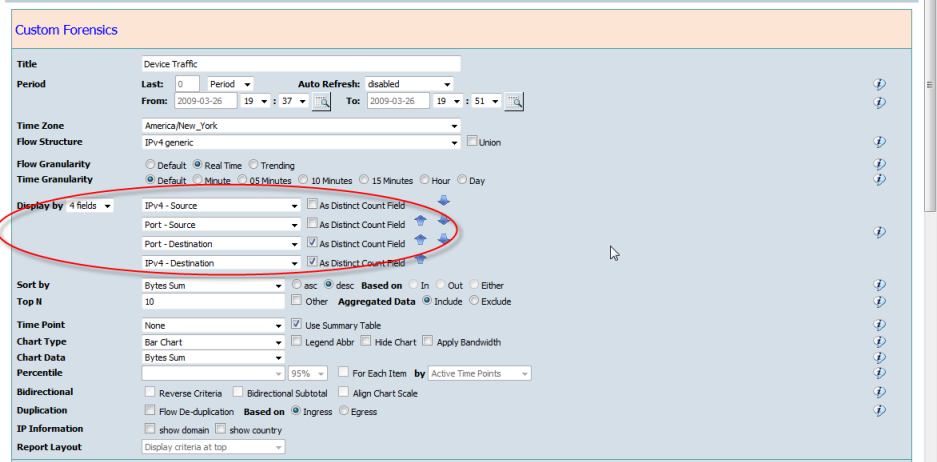
Display by
Forensics allows a maximum of 12 raw netflow fields and more when using correlated field combinations, and allows counting of one or more of the fields.
The Fields you want to count must be at the end of the Display By selection. Multiple fields selected to count will be counted as a group. See Count Analysis
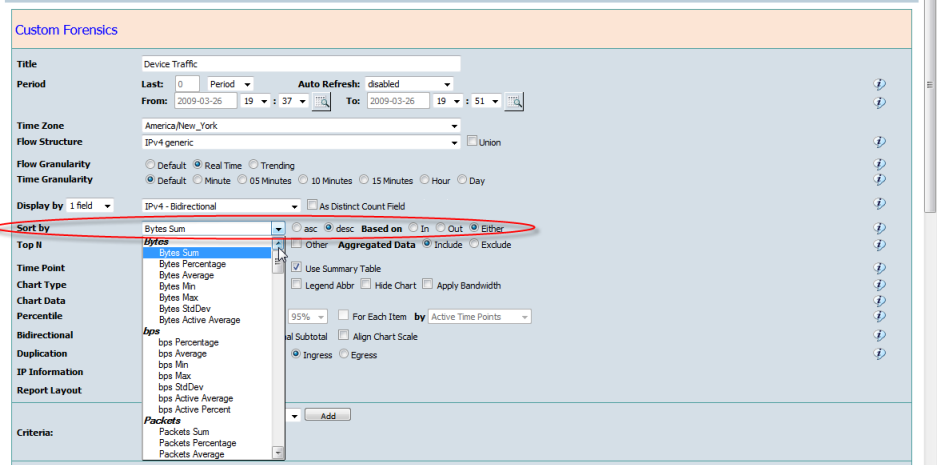
Sort by - Defines the "Order" of the data result in the report. Results can be sorted as "Ascending" or "Descending". When "Display by" fields are bidirectional, like "Interface Group", "Interface", "Account", "CostCentre", "AS", "IP", "Port" then the sort order will be Based on "Inbound", "Outbound", or "Either".
If any field has been selected as a "Distinct Count Field" then the Sort by for Count becomes available for Count Analysis
Top N - Defines the number of rows to display out of the sorted results. The Top N results will be presented in the report, and all other records will be aggregated to "Other" items if "Other" is ticked on.
Increasing the number of rows to display will require longer processing. Use carefully when producing long comparative timelines with many distinct rows
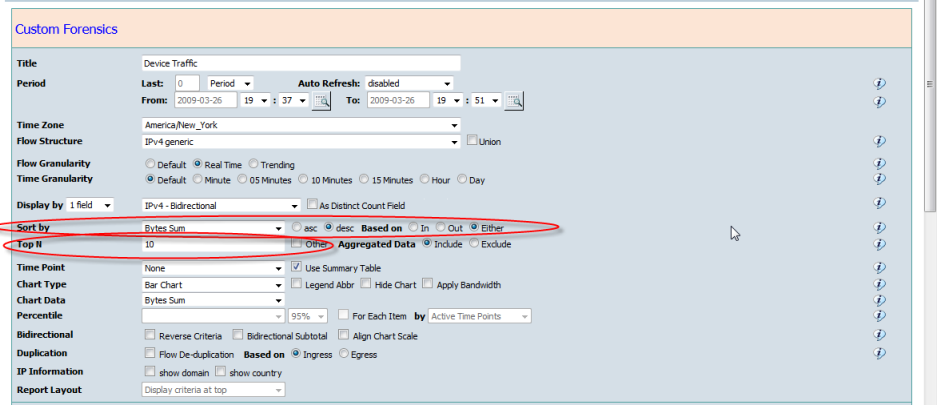
Aggregated Data - The Aggregated Data option is only available when using CySight in Performance License Mode. When running in Performance mode CySight will retain the Top flows as defined in the Performance Mode license key all other data below the Top will be aggregated. The aggregated flows still retain "Interface", "QoS/Tos", "Business Group" and "ASN" subject to the aggregation mode selected in the Aggregated Flow Policy. The aggregated flow policy is defined in the left menu Configuration > Administrator > Site Configuration.
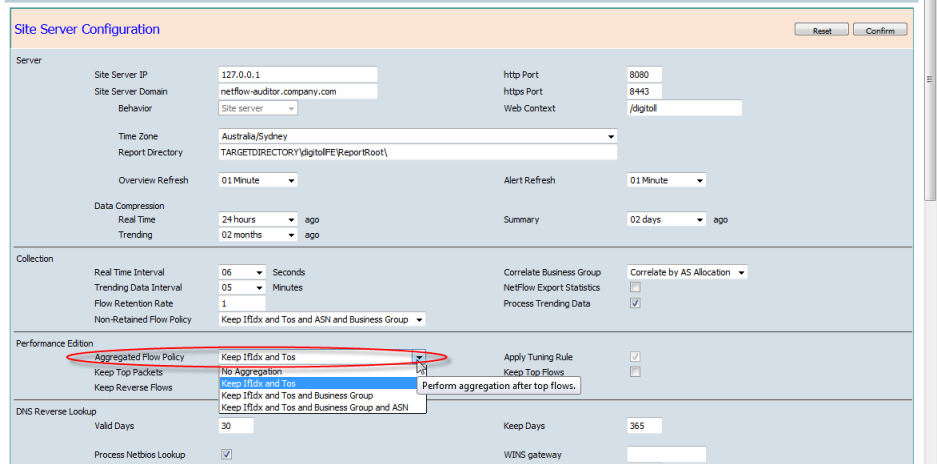
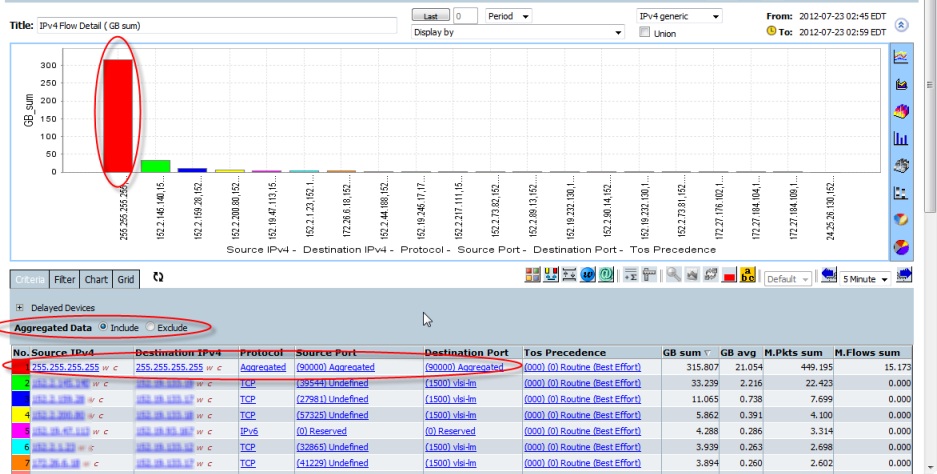
The report will include aggregated flows if "Aggregated Data" is ticked on. In the aggregated flows, the source and destination IPv4 is reset to "255.255.255.255", and source and destination Port is reset to "90000", and source and destination IPv6 is reset to "FFFF:FFFF:FFFF:FFFF:FFFF:FFFF:FFFF:FFFF".
Time Point - Time and Stacked Area chart requires "Time Point" to be Active.
Use Summary Table - will make use of a high-speed summary data archive when a report's fields used in "Display by" and "Criteria" are restricted to "Device Group", "Device", "Interface Group" and/or "Interface".
Chart Type - Allows choice of initial graph to display. Options are; Pie Chart(3D), Bar Chart(3D), Time Chart, Stacked Area Chart and Stacked Bar Chart.
- If there are two "Display by" fields CySight can present netflow traffic with a Stacked Bar(3D) chart.
- Time Chart and Stacked Area chart options are available if "Time Point" is active.
- if "Legend Abbr" is ticked on then the "order sequence number" instead of "Display by" fields value will be displayed on chart .
- The report will only display the data grid when "Hide Chart" is ticked on.
- The stacked area chart will set the scale to the Interfaces bandwidth when "Interface Group" or "Interface" are in criteria.
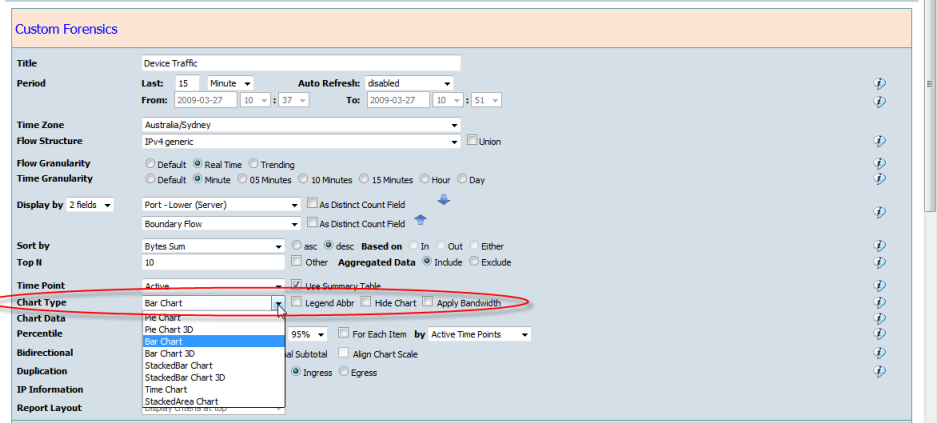
Chart Data - will be set automatically to the "Sort By" value except when "Sort By" is selected as "Field". "Chart Data" can be set to a different value to "Sort By".
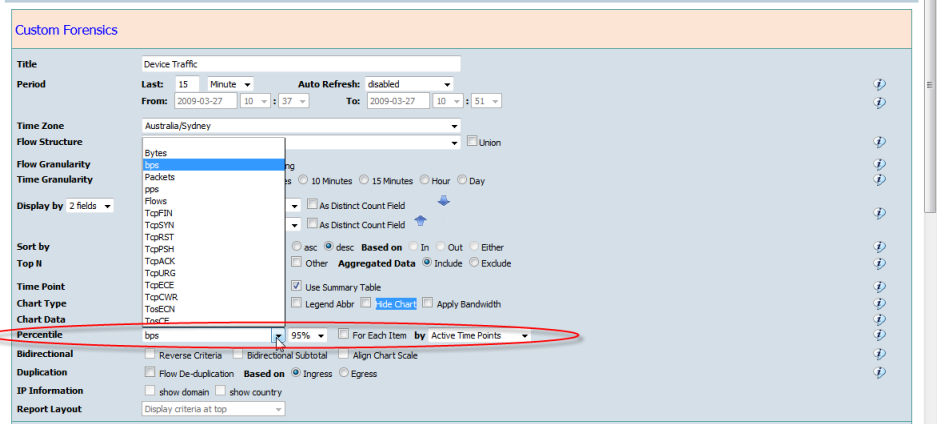
Percentile - Percentile can be calculated on bps, Bytes, Packets, pps, Flows, Tcp-Flags (FIN, SYN, RST, PSH, ACK, URG, ECE, CWR) and TCP-TOS-FLAGS (ECN, CE).
If "For Each Item" is ticked then a Percentile will be calculated as a separate column for each row item in the grid, otherwise only the overall percentile will be calculated.
Percentile can be based on active or period total time point.
Although more commonly used in 95th Percentile reports, Percentile can be calculated as any value between 1% and 99%. Percentile for Real-Time can be used for security anomaly detection purposes or in trending reports for billing. See Percentile Analysis
Bidirectional - CySight can match and combine the In and Out traffic together for bidirectional fields like "Interface Group", "Interface", "Account", "CostCentre", "ASN", "IP" and "Port".
- If "Bidirectional Subtotal" is ticked then the subtotal of In and Out will be calculated.
- If "Align Chart Scale" is ticked then the In and Out traffic chart will be set to the same scale.
- CySight will separate bidirectional fields "Either" criteria to match In and Out traffic of the "Display by" bidirectional field.
- If "Reverse Criteria" is ticked then the separated criteria will match the opposite side of In and Out traffic conversations.
Duplication - CySight can remove the duplicated netflow data from multiple routers/switches. See Config: Topology Visual Links and Deduplication.
IP Information - Allows the domain name and country information to be displayed next to an IPv4 or IPv6 Address in a report.
Report Layout - Define the position the criteria are displayed in a PDF report.
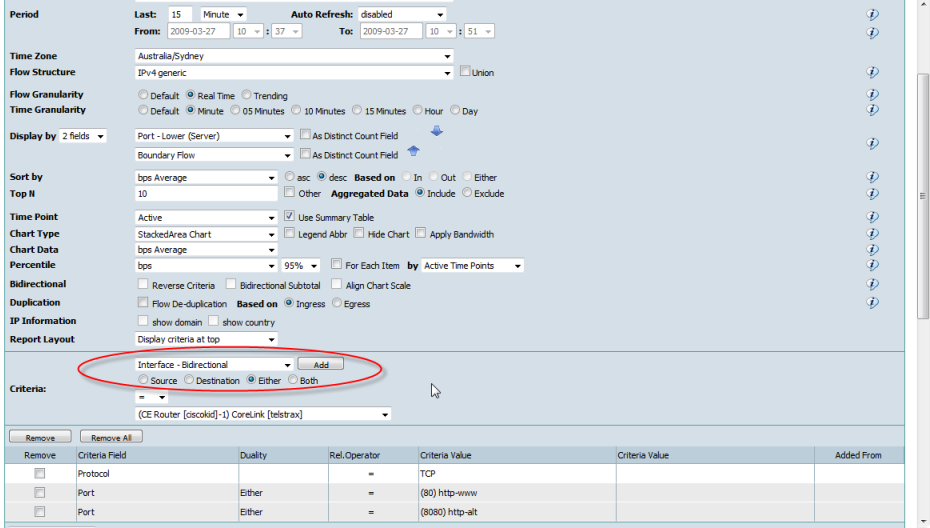
Criteria - Any raw fields in netflow or correlated fields can be used as criteria.
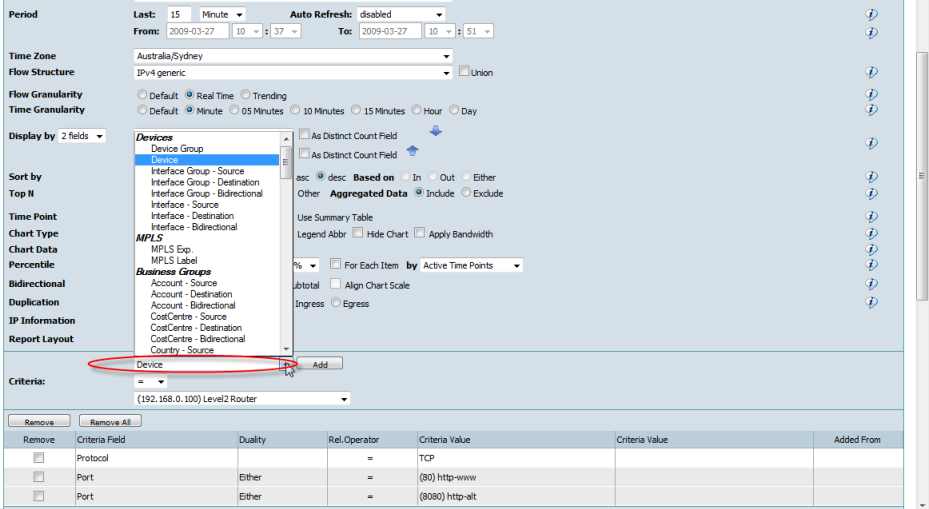
The Bidirectional fields are; "Interface Group" "Interface", "Account", "CostCentre", "IP" and "Port".
When Bidirectional fields are added to the criteria, the extra options "Source", "Destination", "Either" or "Both" will become available;
- Source - the field value at source side of a conversation
- Destination - the field value on the destination side of a conversation.
- Either - the field value at either source or destination side on either side of a conversation.
- Both - the field value at both source and destination sides of a conversation. Most logically used with "not equal", "not like", or "not between".
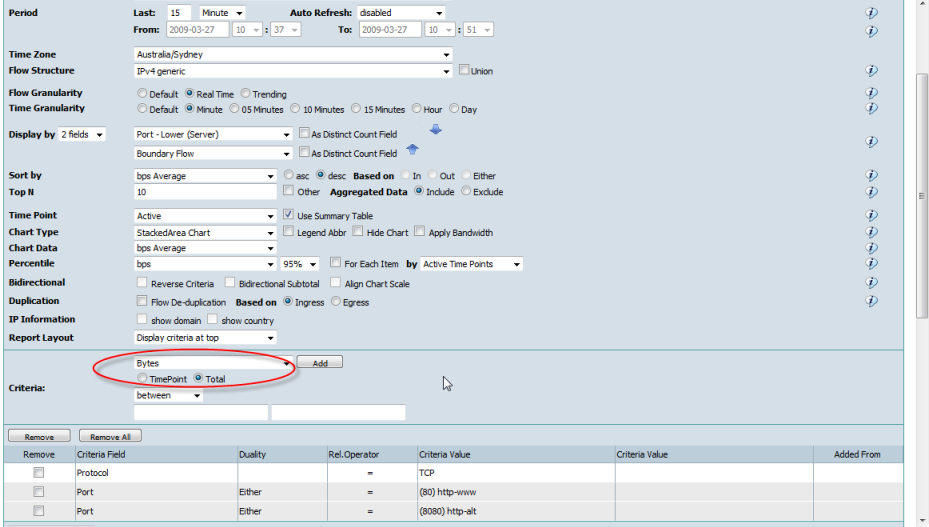
When netflow Measurement fields such as "Bytes" "Packets", "Flows", "TcpFlags", are added to the criteria, the extra options "Time Point" and "Total" will be available.
"Time Point" refers to the point on the time line subject to the point being per minute, per 15 minutes, per hour and so forth.
Check the result of a report when using "Time Point" in the criteria to ensure the time point is what you are expecting when using default Time Granularity."Total" refers to the Sum of the Measurement field for the Period of the report.
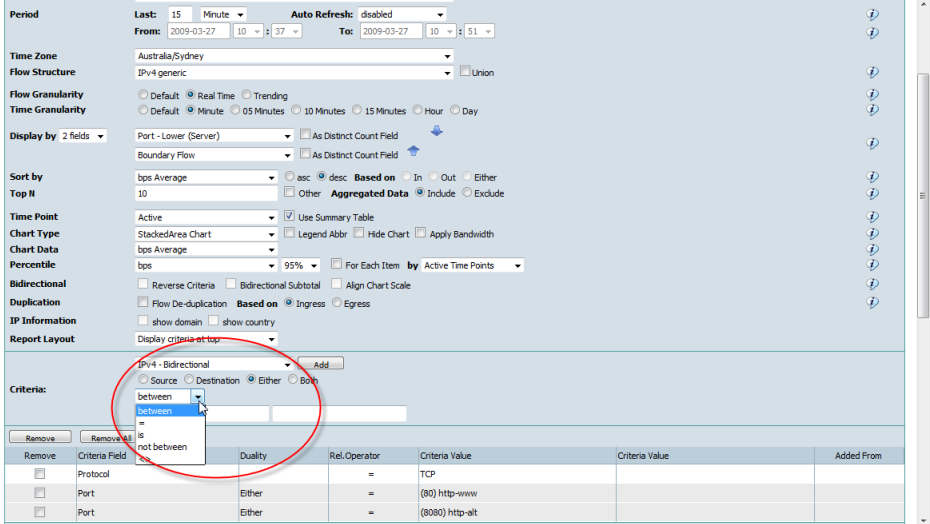
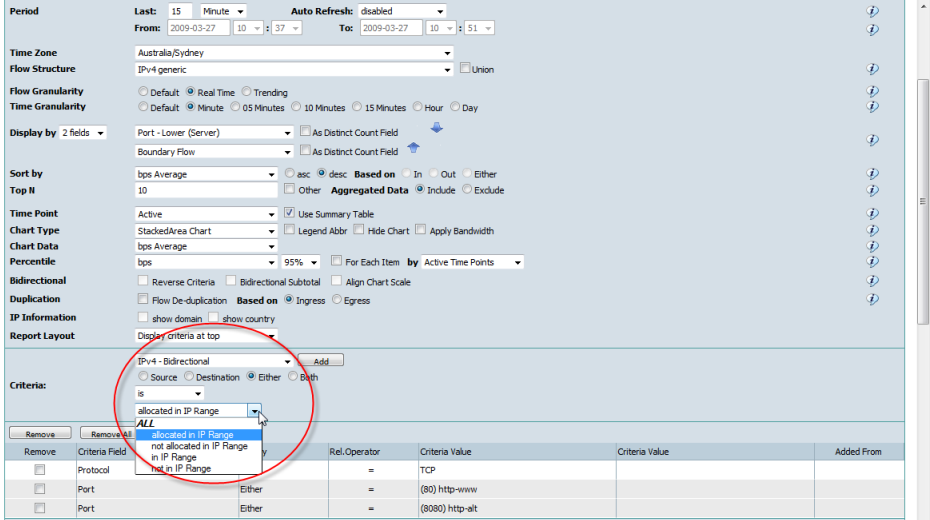
The Criteria field and relationship operators provide drop down lists or other options suited to each of the different criteria fields.
HOW LOGIC WORKS WITH MULTIPLE CRITERIA
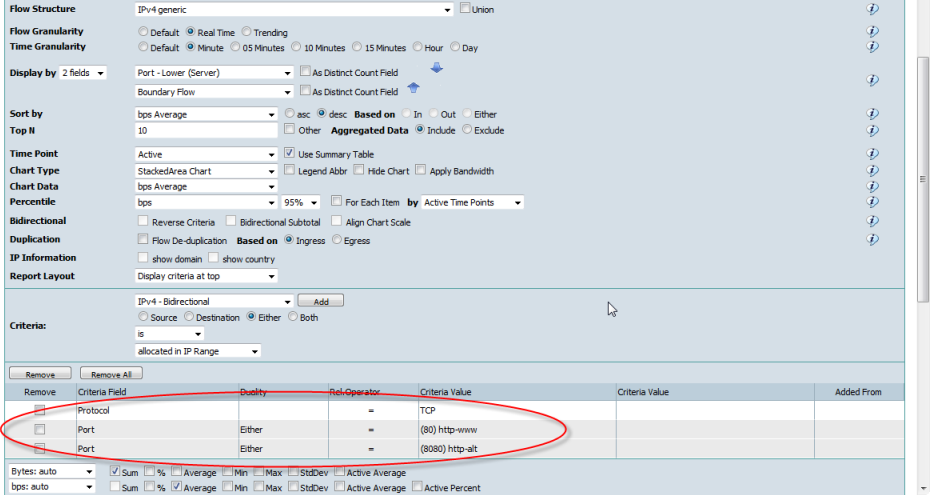
DIFFERENT criteria fields are combined with a logical "AND"
LIKE criteria fields are combined with a logical "OR"
e.g. the following logic is:
Protocol=TCP AND (EITHER the "Source" or the "Destination Port" is 80 OR 8080)
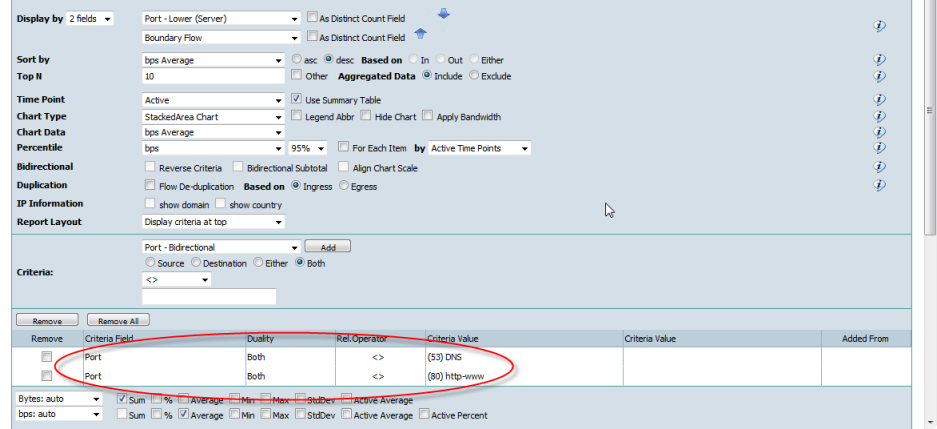
LIKE criteria fields using "not equal", "not like", or "not between" operators are combined with a logical "AND"
e.g. the following logic is :
BOTH the Source and Destination Port are NOT 53 AND NOT 80.
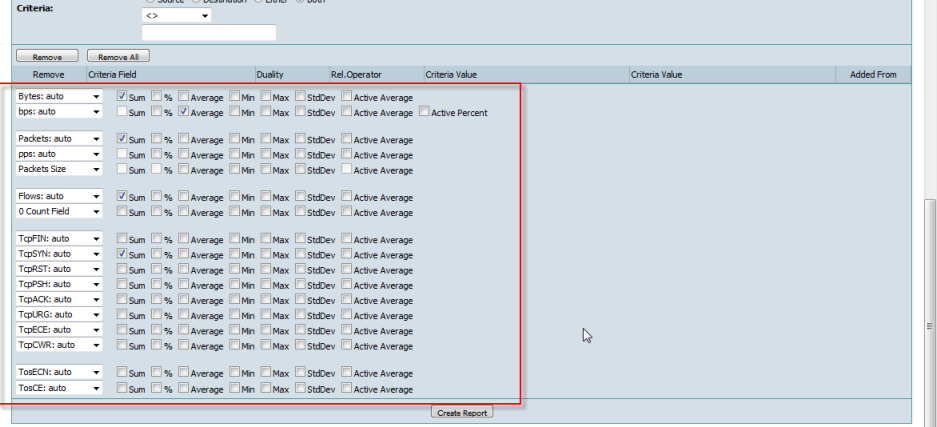
Measurement Grid Columns
The selected measurements and their statistical value will be included in the report.
The Selected measurements are set by default to use "auto". This will automatically find the most appropriate measurement to use for the report result. If specific units of measurement are required in Units, Kilo, Mega, Giga or Terra then these can be selected.
By default multiplier 1024 is used to auto calculate bytes and bps in Kilo, Mega, Giga or Terra:
eg 1 megabyte = 1024 bytes.
The 1000 multiplier is available for those organizations that consider 1 megabyte = 1000 bytes.