The zooming functionality is available for the CySight charting applet. Users can zoom into all bar, line and area charts.
You can zoom into a report to reveal more intricate details.
Note: By default (except in the case of a baseline report) the grid will update as you select a time area. To "float" through the graph data without the grid updating, click "Chart tab" and disable the "Zoom Option".
To zoom down into a report:
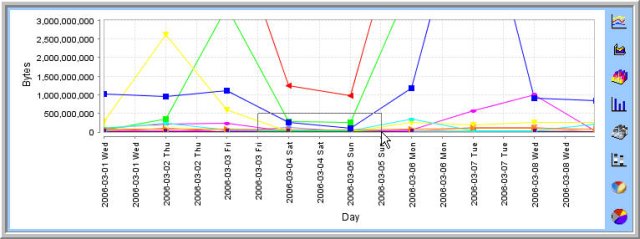
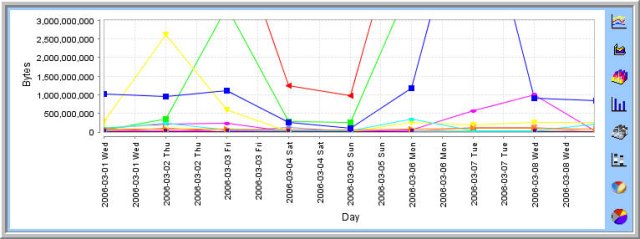
Step 1: Generate a report. Following is an example of a weekly baseline report.
Step 2: For line charts focus choose zoom mode (
 ). Zoom mode is a toggle option of Drag mode click on drag mode (
 ) to change to zoom mode.
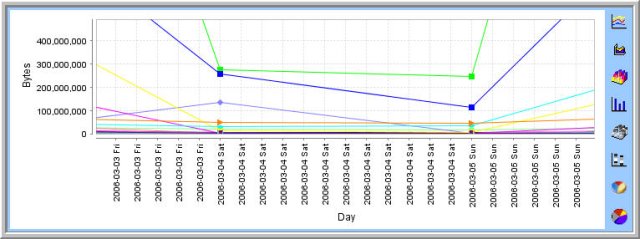
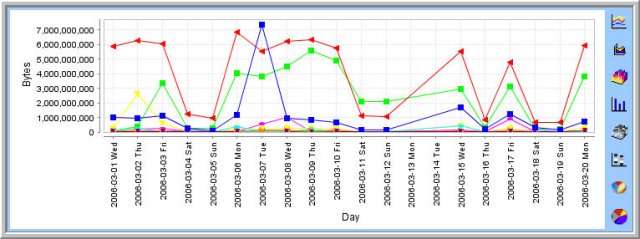
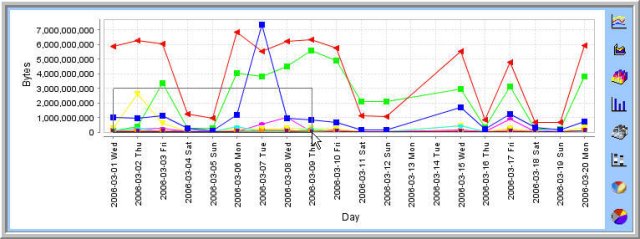
Step 3: Drag the mouse to select an area within the graph into which you wish to drill down.
Step 4: A new graph is displayed elaborating only the selected area with greater detail.
Step 5: Repeat Step 2, as many times as you want.