The Diagnostics screen has a number of Components:
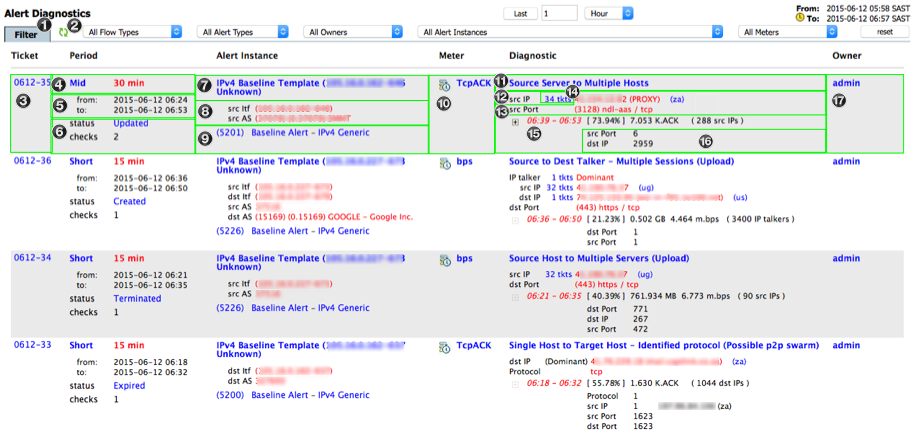
- (1) Filter Tab
- (2) Refresh toggle
- (3) Ticket Number
- (4) Age
- (5) Ticket Term
- (6) Status
- (7) Baselined Item (Usually Device/Interface)
- (8) Absolute Route and AS Path
- (9) Baseline Alert ID
- (10) Meter
- (11) General Diagnostic
- (12) Dominant
- (13) Sub-Dominant
- (14) Repeat Offenders
- (15) Checkpoint: Dominant Profile
- (16) Checkpoint: Sub-Dominant Profile
- (17) Owner
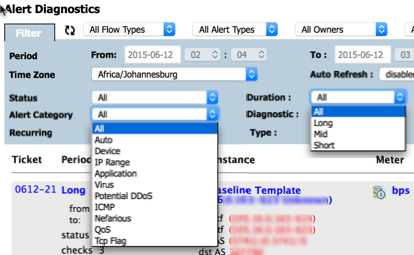
Clicking on the blue links of the Diagnostics screen will filter the diagnostics
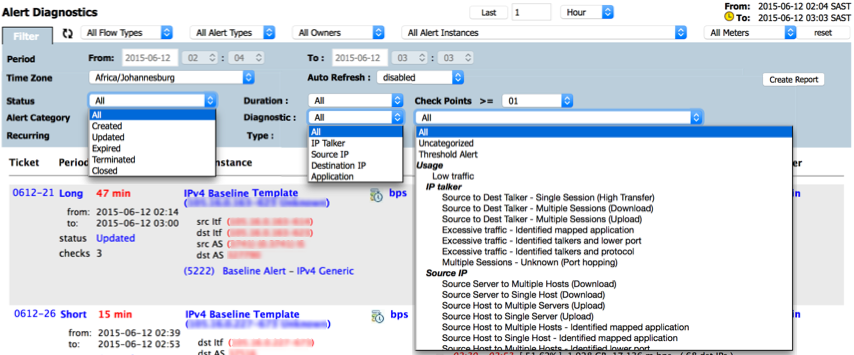
During the creation of a new Baseline/Threshold Alert an Alert Category is assigned.Diagnostics: 1. Introduction
Usually the Alert category is "Auto" and this will tell CySight to run diagnostics on an Alert. The Alert Templates are assigned an "Auto" alert category automatically
Diagnostics: 2. Setup baseline learning
Diagnostics: 3. Monitoring Alerts and Tickets
Diagnostics: 4. Diagnostics screen deciphered
Diagnostics: 5. SNMP Traps and Email Notifications