Diagnostics: 4. Diagnostics screen deciphered
Posted: Fri Jun 12, 2015 6:02 am
The record of a recurring Baseline or Threshold alert are shown in the Diagnostics screen. The Baseline may have been manually created or created automatically by CySight or during the Alert Template setup process.
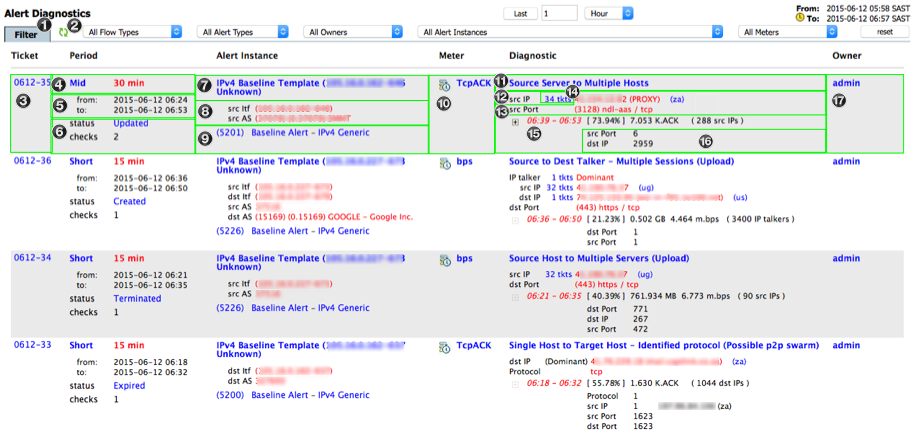
The Diagnostics screen has a number of Components:
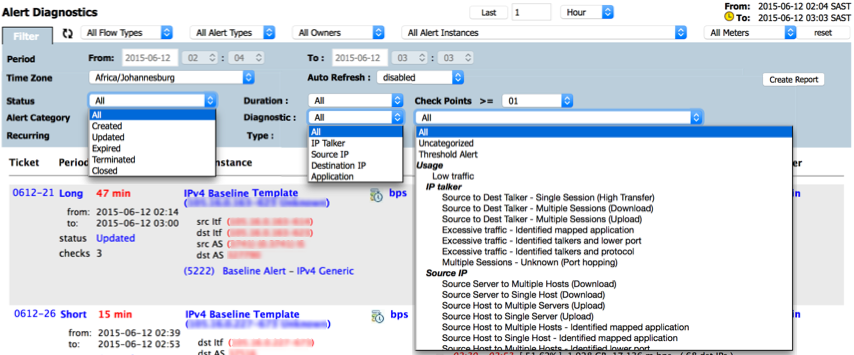
Clicking on the blue links of the Diagnostics screen will filter the diagnostics
Diagnostics: 2. Setup baseline learning
Diagnostics: 3. Monitoring Alerts and Tickets
Diagnostics: 4. Diagnostics screen deciphered
Diagnostics: 5. SNMP Traps and Email Notifications
The Diagnostics screen has a number of Components:

- (1) Filter Tab
- (2) Refresh toggle
- (3) Ticket Number
- (4) Age
- (5) Ticket Term
- (6) Status
- (7) Baselined Item (Usually Device/Interface)
- (8) Absolute Route and AS Path
- (9) Baseline Alert ID
- (10) Meter
- (11) General Diagnostic
- (12) Dominant
- (13) Sub-Dominant
- (14) Repeat Offenders
- (15) Checkpoint: Dominant Profile
- (16) Checkpoint: Sub-Dominant Profile
- (17) Owner
Clicking on the blue links of the Diagnostics screen will filter the diagnostics

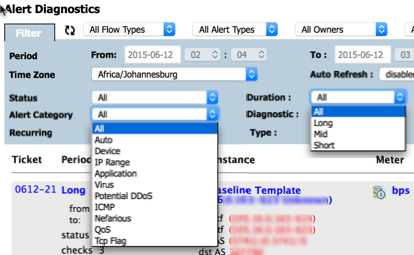
During the creation of a new Baseline/Threshold Alert an Alert Category is assigned.Diagnostics: 1. Introduction
Usually the Alert category is "Auto" and this will tell CySight to run diagnostics on an Alert. The Alert Templates are assigned an "Auto" alert category automatically
Diagnostics: 2. Setup baseline learning
Diagnostics: 3. Monitoring Alerts and Tickets
Diagnostics: 4. Diagnostics screen deciphered
Diagnostics: 5. SNMP Traps and Email Notifications
