Forensics: 2.(b) Time Chart Selection & Drilldown
Posted: Tue Aug 14, 2007 12:28 pm
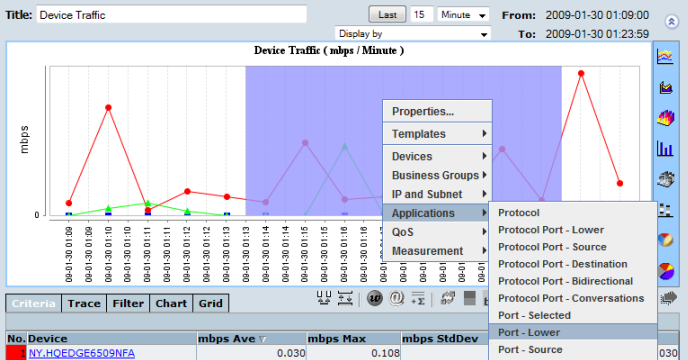
The drill-down functionality of CySight gives the user single point analysis of traffic from the charting applet. All charts can be analyzed through the drill-down menu by using the right-click button of the mouse.
To drill-down into a chart:
Step 1: For line charts focus on a single point by clicking on a single point or drag and choose a number of points if in zoom drag mode ( ).
).
For bar, area and pie charts skip to step 2. For charts with a lot of detail zoom in for more accurate drill-down analysis. See Zooming in.
Step 2: Right-click on the focus point/area to access the drill down menu.
Step 3: Select from the drill-down menu to analyze Devices/Business Groups/Applications/Time.
Step 4: Continue to drill-down on single points to further analyze traffic.
To drill-down into a chart:
Step 1: For line charts focus on a single point by clicking on a single point or drag and choose a number of points if in zoom drag mode (
).For bar, area and pie charts skip to step 2. For charts with a lot of detail zoom in for more accurate drill-down analysis. See Zooming in.
Step 2: Right-click on the focus point/area to access the drill down menu.
Step 3: Select from the drill-down menu to analyze Devices/Business Groups/Applications/Time.
Step 4: Continue to drill-down on single points to further analyze traffic.